Platform
Developers
Resources
Documentation
Walkthrough Guides
SDKs and APIs
Integrations
A/B Testing Calculator
How Statsig Works
Blog
Support
Customer Stories
Events
Build vs Buy
Contact Sales

Feature Flags Liberated
Gating features is a core part of the development process. And with Statsig, it's free.
How AI Companies Use Statsig
The best AI companies use Statsig to accelerate growth. Learn how you can do the same.
What is Product Observability?
Product observability means being able to monitor, control, and gain insight into all of your features.Documentation
Walkthrough Guides
SDKs and APIs
Integrations
A/B Testing Calculator
How Statsig Works
Blog
Support
Customer Stories
Events
Build vs Buy
Contact Sales
Experiments with Generative AI
We built a generative AI app in reactJS using OpenAI’s API and Statsig. Here’s what we learned:
Experimentation Platforms
The decision to build versus buy an experimentation and feature flagging platform is not an easy one.
CUPED Explained
CUPED is an implementation that uses pre-experiment data to explain the variance in the result data.Run experiments with more speed and accuracy
We’re pleased to announce the rollout of CUPED for all our customers. Statsig will now automatically use CUPED to reduce variance and bias on experiments’ key metrics. This gives you access to a powerful experiment tool being used at top tech companies like Microsoft, Facebook, Airbnb and more.
CUPED is a technique where we leverage pre-experimental data to reduce variance and pre-exposure bias in experiment results. This can significantly shrink confidence intervals and p-values, reduce the required sample sizes (and correspondingly durations) needed to run experiments, and will ultimately help you to move more quickly and with more confidence.
How this will help you
Waiting for experiments to gather sufficient sample size can be a major blocker to companies at any scale. Because of this, various techniques have been developed to reduce the variance (or “noise”) in experimental data, and reduce the amount of time teams spend waiting for results.
CUPED (Controlled-experiment Using Pre-Experiment Data) is one of these techniques, publicized for this use case by Microsoft in 2013. In our implementation, we use users’ metrics from the period just before an experiment launched to adjust their metrics for that experiment. This can help to reduce variance and bias, which we’ll jump into below.
Variance Reduction
In the hypothetical example below, we run an experiment that increases our mean metric value from 4 (control) to 6 (variant). However, because of the noise in the population there’s a lot of uncertainty in this estimate, and it’s unclear if the data is showing a real difference.
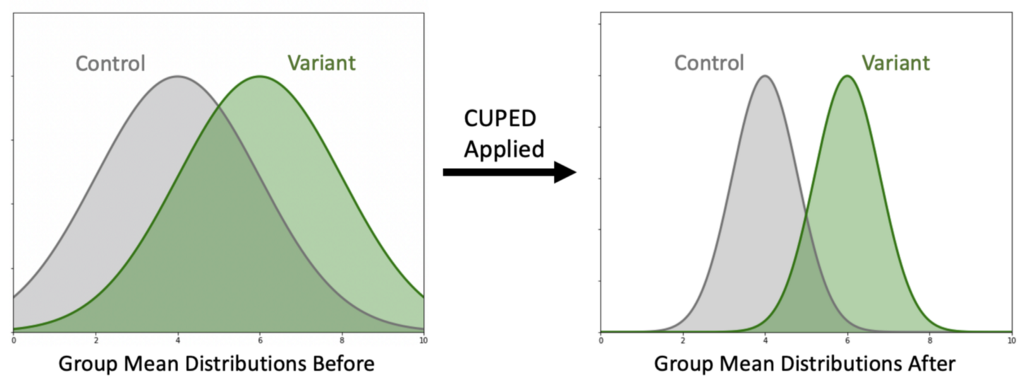
Applying CUPED improves the precision of our mean estimates, and makes it clearer that the populations are different. For the experimenter, this means smaller confidence intervals and lower p-values at the same effect size.
This works by using pre-experiment data to “explain” some of the observed variance. Instead of treating users’ metric outcomes as only depending on their experiment group, we treat each user’s metrics as being based on both their experiment group and their own past behavior. The more users’ past behavior is correlated with their future behavior, the more variance we can explain away in this way.
Bias Correction
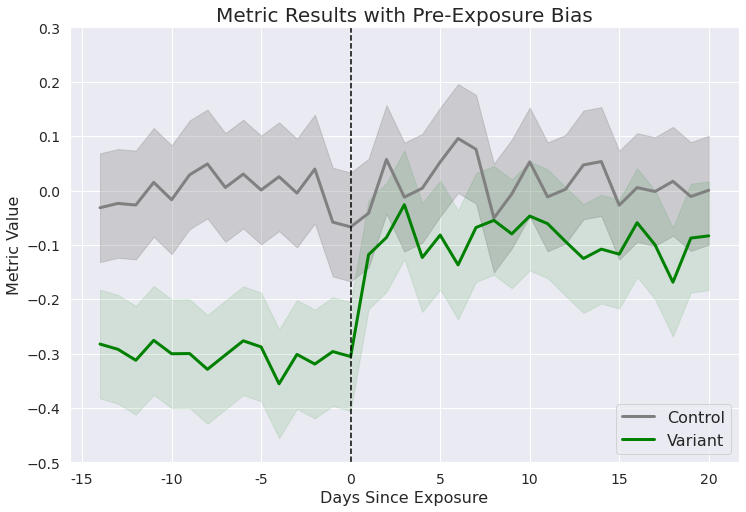
Randomization doesn’t result in perfectly balanced groups. In rare cases you will see large differences between groups even before an experiment started, which is referred to as pre-exposure bias. In addition to variance reduction, CUPED is also a way to reduce pre-exposure bias.
In the chart below, we see an experiment whose results would look fairly neutral. However, it’s clear that users saw a meaningful lift after they were exposed to the variant — they just started off with much lower values. (It’s worth mentioning that a bias this extreme is very rare!)
CUPED can shrink this gap. Users who had higher-than-average pre-exposure data will have their metrics adjusted downwards, and vice versa. Accordingly, if the average user in the Variant group had a lower pre-experiment metric than the average user in Control, CUPED will close this gap by reducing the average Control user’s metric and increasing the average Variant user’s metric.
If we apply the adjustment to both the pre and post-exposure values to demonstrate, the CUPED-adjusted values might look like the chart below, closing some of the gap between the pre-exposure metrics.
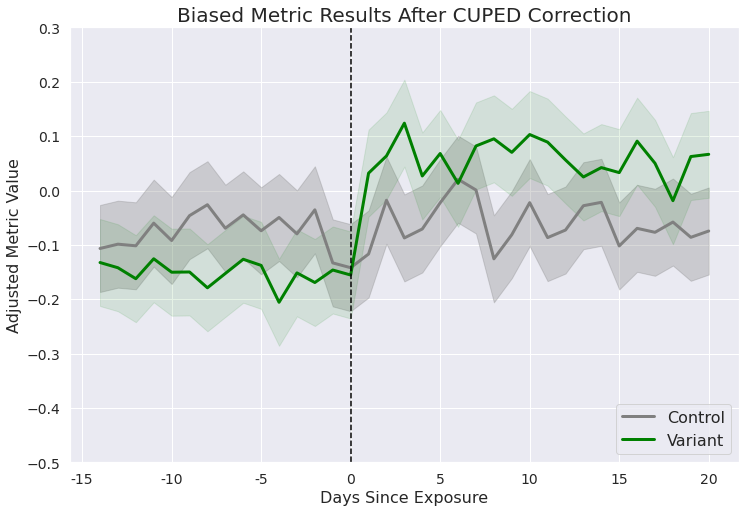
Now the results will reflect the reality that this experiment drove an increase for users in the test group!
Our Approach
Following Statsig’s values, we’re shipping this quickly so that you can ship quickly. We’re using a simple and battle-tested version of this approach, where we use a user’s metric value from before an experiment startsto reduce the variance on thatsame metric in your experiment results.
We’ll be monitoring this as it rolls out to understand how effective this is and if there’s any next steps we can take to level up our approach.
Early Results
We don’t want you to have to wait for a full-fledged white paper before we give you a peek under the hood, but we also don’t want to only give you vanity stats on this tool. Here’s a brief rundown of the results we’ve seen in testing.
Sample Size / Variance Reduction
To understand the impact this will have on sample sizes, we looked at relevant experiment metrics (see note below) from 300+ customers to see how much CUPED would reduce required sample sizes (and experiment run times) due to lower metric variance:
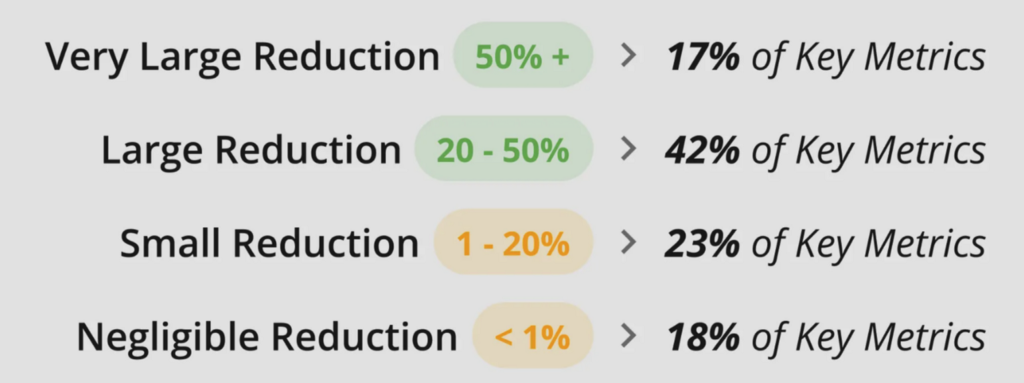
Based on those results, we’re confident that CUPED will help people to move faster, with more confidence. It isn’t a magic bullet which makes every experiment run twice as fast, but we can already see that the value is there on real customer experiments.
This drop in required sample size corresponds to more precise results for the same sample size. An experiment where CUPED would reduce the required sample size by ~50% would shrink confidence intervals by ~30% if you kept the original sample size — leading to more Statistically significant results.
Significance
On the same set of experiments, we saw that about 9% of experiments had a key metric turn out to be statisticallysignificant* after applying CUPED, where it was previously not statistically significant. This is because of some combination of variance reduction and reducing a pre-exposure bias that previously made the experiment look less impactful than it was.
Conversely, about 2% of experiments saw a previously statistically significant result turn out to not be statistically significant. This is an important result! The likely explanation is that experiments which were previously false positives due to pre-exposure bias are now correctly categorized — meaning those results are more accurate.
How to work with CUPED
The effectiveness of CUPED varies across user populations and metrics. It’s worth knowing what to look for!
The more stable a metric tends to be for the same user over time, the more CUPED can reduce variance and pre-experiment bias
CUPED utilizes
pre-exposure
data for users, so experiments on new users or newly logged metrics won’t be able to leverage this technique
Getting in the habit of setting up key metrics and starting to track metrics before an experiment starts will help you to get the most out of CUPED on Statsig
It’s common for growth-stage companies to be running lots of experiments focused on new user acquisition and conversion. We also have lots of companies which are new on the platform and tend not to have all of their logging set up. As companies mature in their usage and adoption of Statsig, we expect to see CUPED become more and more effective.
*For the analysis above, we limited our dataset to experiments where over 50% of the users in the experiments could have CUPED adjustments applied. This filters out experiments with mostly new users, or metric results on metrics which don’t have sufficient history to calculate pre-experiment data.
Let’s Ship!
CUPED-adjusted results will be available in your key metric results across all experiments in the new results card in the coming days. Look for the “CUPED” flag above your key metrics.

Give it a try, check out the docs, and let us know how it’s working for you!
Stay ahead of the curve


Recent Posts
Migrating your feature flags from LaunchDarkly to Statsig
Switching from LaunchDarkly to Statsig can help improve workflows, streamline feature management, and give your team's experimentation culture a fresh start.
Announcing Session Replay
What if you could rewind the exact moment a user didn't convert through a funnel and watch how it unfolded?
Mastering marketplace experiments with Statsig: A technical guide
Marketplace experiments can have a ripple effect, impacting buyers, sellers, and the health of your platform. Here's how to experiment effectively.
Product analytics 101: Video Recording
Watch Akin Olugbade's recorded session wherein he discusses how to cultivate a data-driven culture using analytics, and why we decided to create this product.
Running experiments on Google Analytics data using Statsig Warehouse Native
Leveraging Google Analytics data for experimentation is powerful. Statsig Warehouse Native can help.
When to use Bayesian experiments: A beginner’s guide
Where frequentist statistics assigns probabilities to data, Bayesian assigns probabilities to hypotheses. Here's why some experimenters opt for the latter.