Products
Solutions
Resources
Product Analytics
Analytics for teams that ship
Build with the only product analytics platform that connects data,
decisions, and deployment
Why Choose Statsig for Product Analytics?
Statsig is the only product analytics platform that can power your
entire product development lifecycle - from helping you understand
users, to deciding what to build, to measuring the impact of
everything you ship
Trustworthy data, in one place
Consolidate your product data into one trusted source - in your warehouse, or ours
All the best tools, all together
Get enterprise-grade product analytics that seamlessly integrate with flags and experiments
Unrivaled value
Statsig is the most affordable analytics platform at any scale - from our free tier to enterprise plans
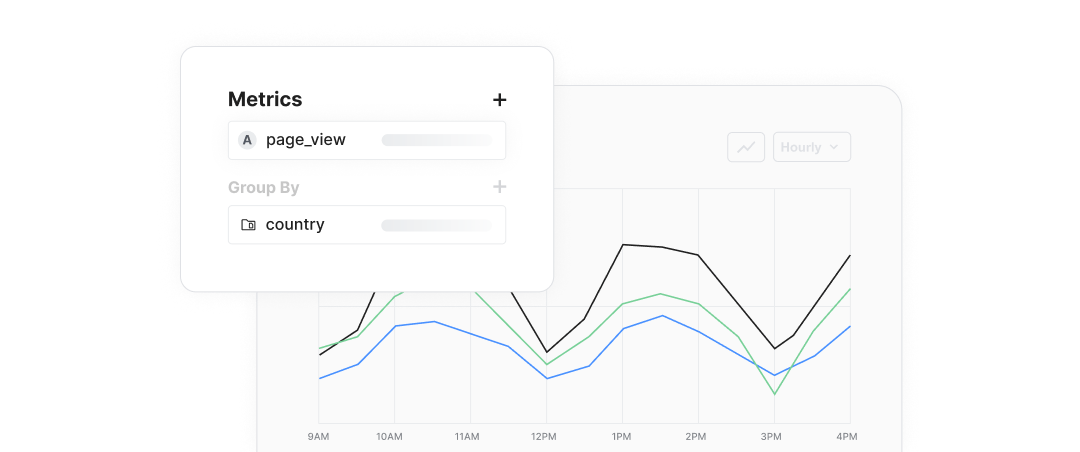
Take the guesswork out of building
Give your team access to enterprise analytics. Understand users,
find growth opportunities, and track performance without writing SQL
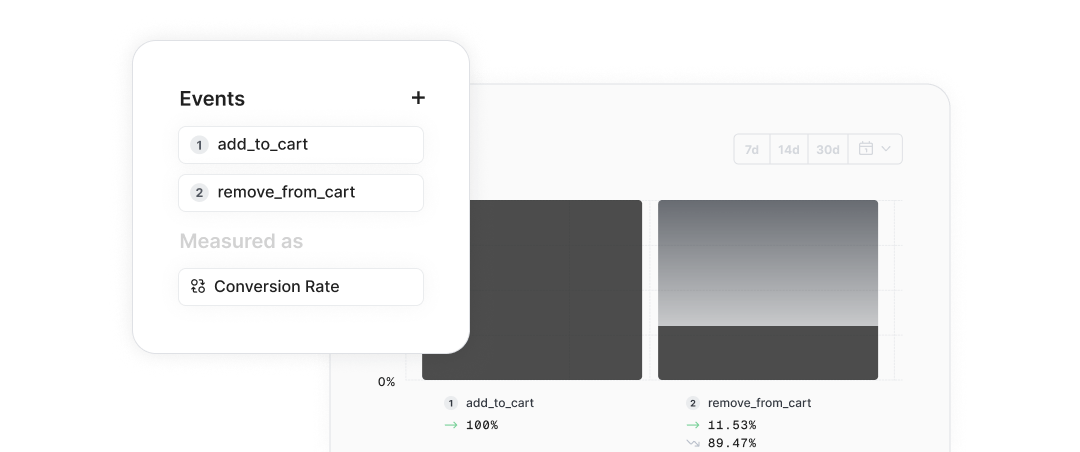
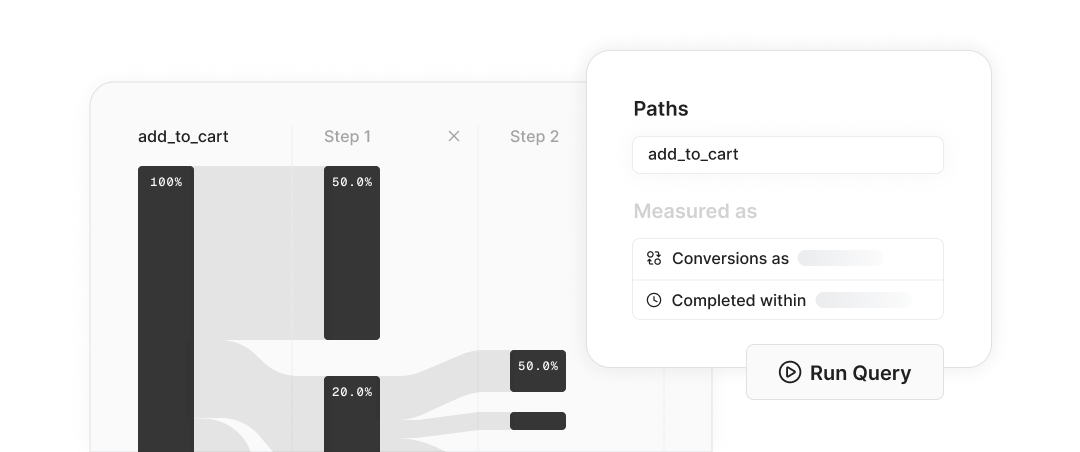
Optimize conversion funnels
Define custom funnels to identify drop-offs. Use flags to track
how releases impact conversion, then launch experiments to improve quickly
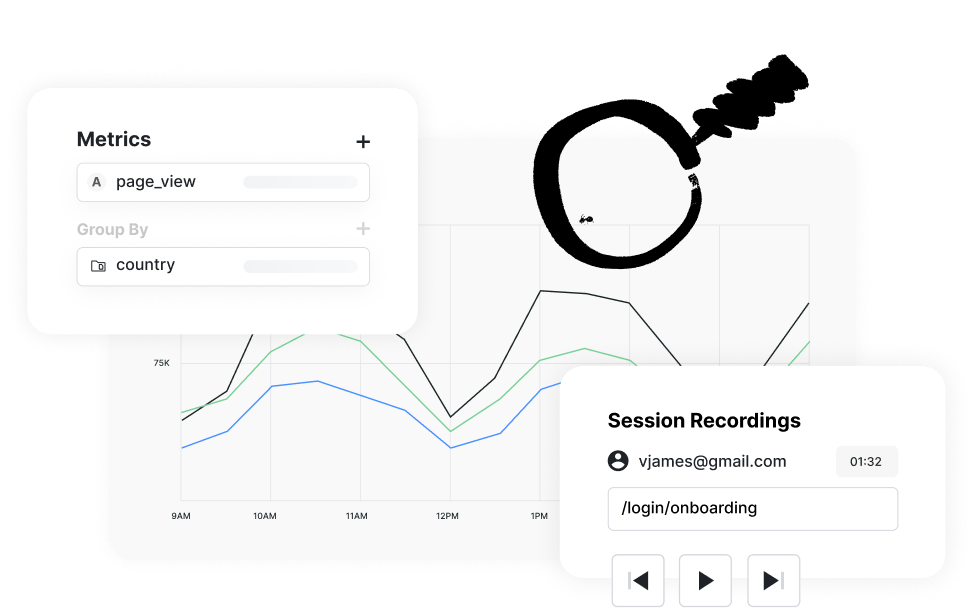
Analyze user journeys
Explore paths users take within your product. Understand behavior
before and after key actions, measure feature impact, and find UX improvements
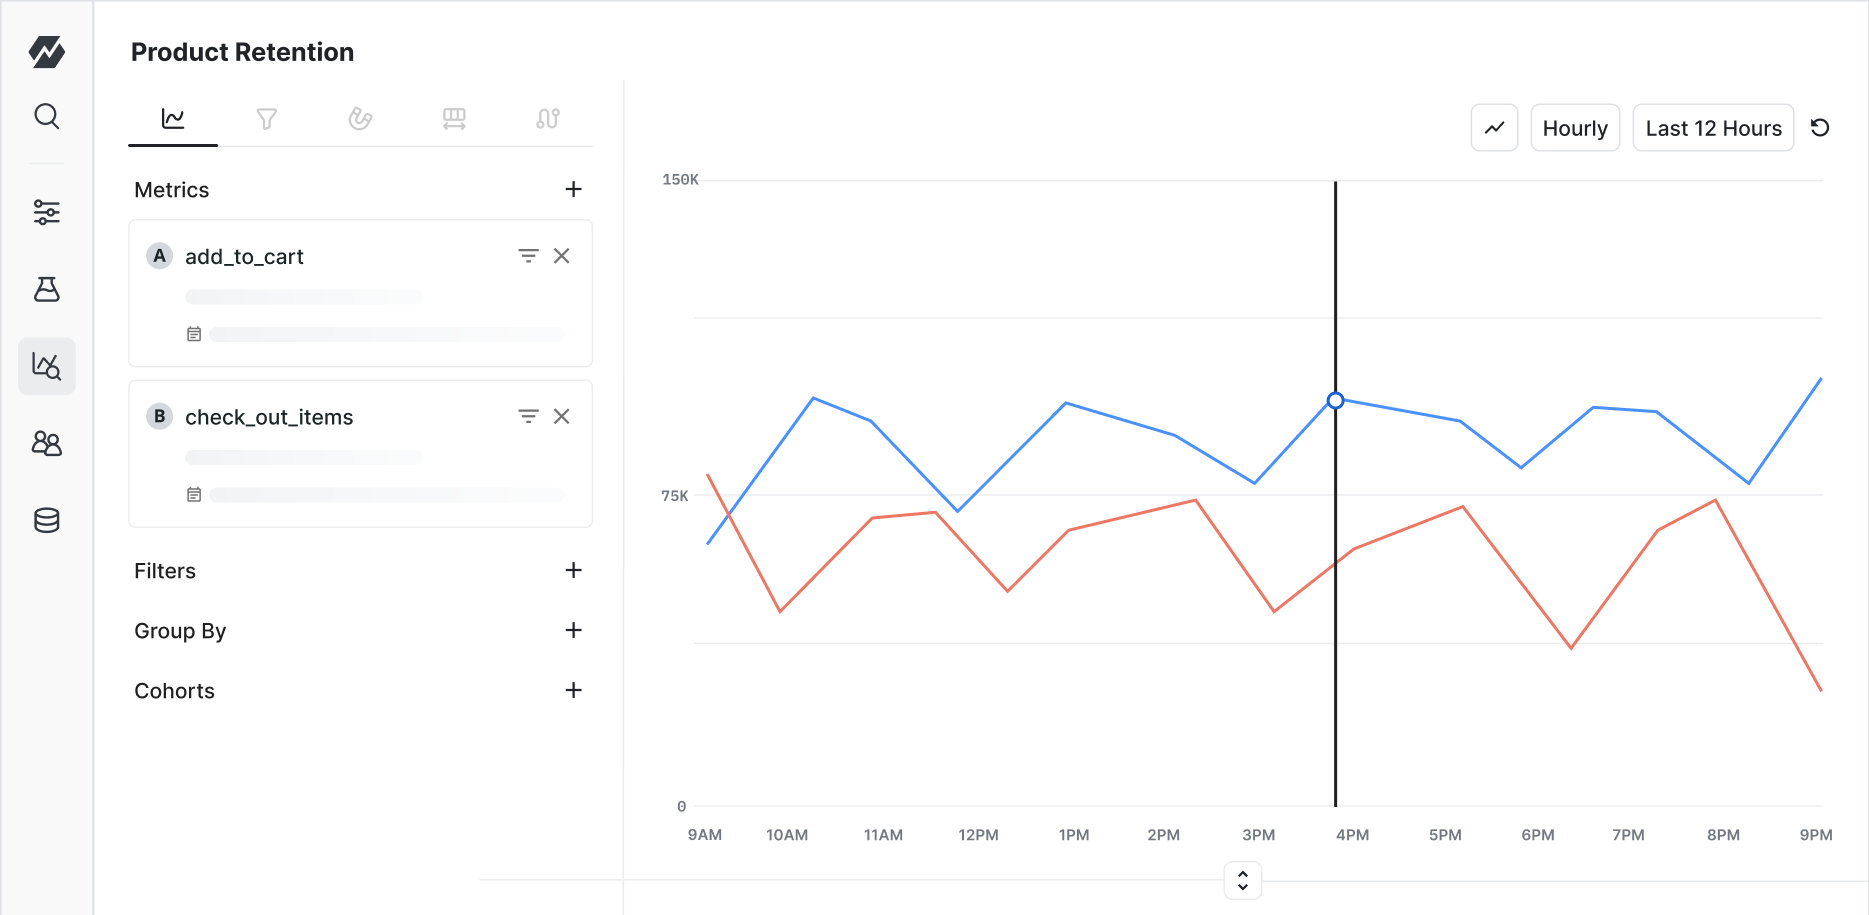
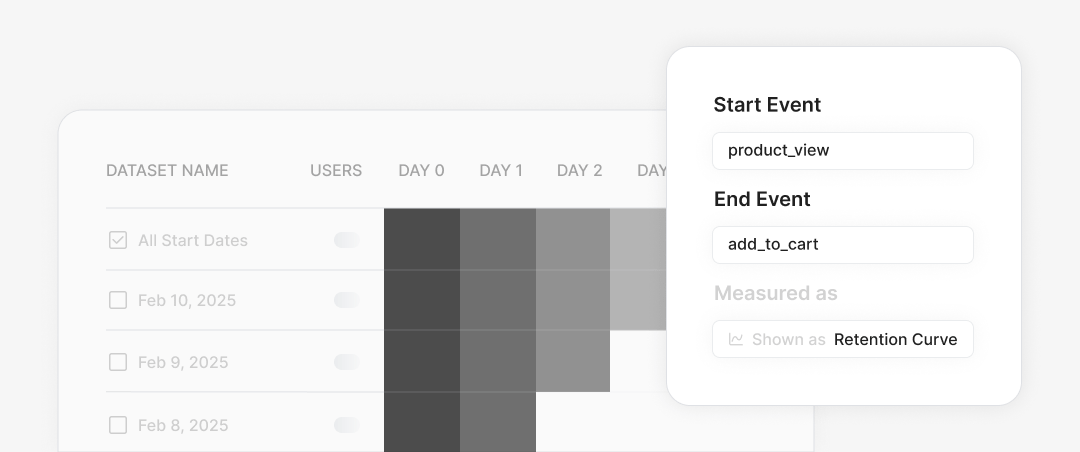
Drive engagement and retention
Track engagement patterns and retention trends. Get complete user
metrics including DAU/WAU/MAU, retention, stickiness, and L7/L14/L28
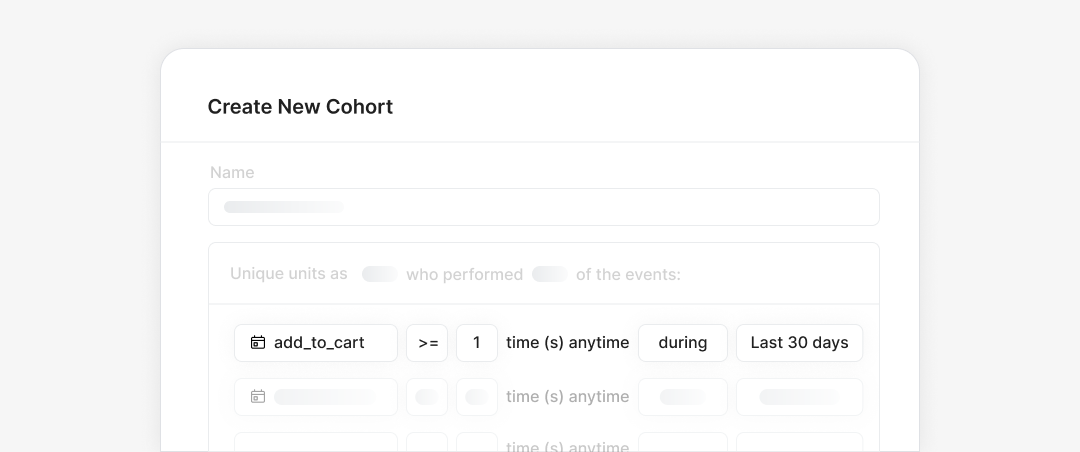
Understand how user cohorts behave
See how different segments engage with your product. Define key
cohorts like power users or churn risks, then make targeted improvements
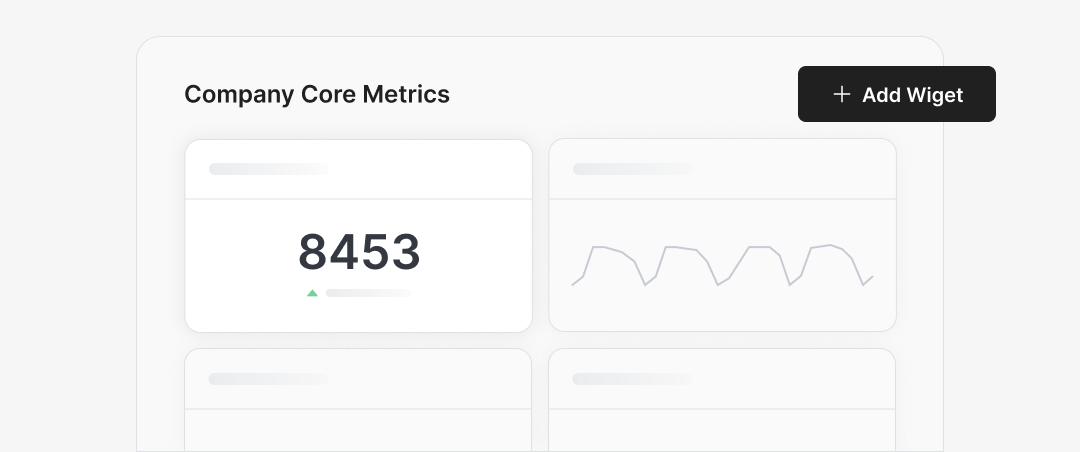
Share context with the whole team
Create centralized views of product performance to visualize key
metrics, monitor trends, and share insights across your entire team
Integrating experimentation with product analytics and feature
flagging has been crucial for quickly understanding and addressing
our users' top priorities
Dave Cummings
Engineering Manager
Statsig's powerful product analytics enables us to prioritize
growth efforts and make better product choices during our exponential
growth with a small team
Rose Wang
Chief Operating Officer
We use Statsig's analytics to bring rigor to the decision-making
process at Wizehire. Their tools help us quickly figure out which
features are valuable
Nick Carneiro
Chief Technology Officer
Included with the Statsig platform

Warehouse Native
Run Statsig in your data warehouse for improved security, reliability, and data governance

30+ SDKs
Build with high-performance, open-source SDKs in (almost) every language

Enterprise-grade infra
Ship with infrastructure that is built to handle trillions of events and billions of users

Native integrations
Access a variety of integrations with CDPs, observability tools, and other providers
See how customers scale analytics

Bluesky grew to 25 million users in record time
Bluesky unlocked user insights, developed ideas to
test, and validated their hypotheses using Statsig's all-in-one
platform

Matsmart increased experimentation velocity by 11x
Matsmart-Motatos leveraged Statsig's product analytics,
feature flags, and experimentation to enable the entire organization
to build with data

LAAM increased conversions by 75%
LAAM analyzed data from 3 million MAUs, identified
drop-offs in their funnels, and A/B tested every change to optimize
conversions
Loved by customers at every stage of growth
See what our users have to say about building with Statsig
"Statsig's experimentation capabilities stand apart from other platforms we've evaluated. The ease of use, simplicity of integration help us efficiently get insight from every experiment we run. Statsig's infrastructure and experimentation workflows have also been crucial in helping us scale to hundreds of experiments across hundreds of millions of users."
Paul Ellwood
Head of Data Engineering
"We evaluated Optimizely, LaunchDarkly, Split, and Eppo, but ultimately selected Statsig due to its comprehensive end-to-end integration. We wanted a complete solution rather than a partial one, including everything from the stats engine to data ingestion."
Don Browning
SVP, Data & Platform Engineering
"Excited to bring Statsig to Whatnot! We finally found a product that moves just as fast as we do and have been super impressed with how closely our teams collaborate."
Rami Khalaf
Product Engineering Manager
"Statsig has enabled us to quickly understand the impact of the features we ship."
Shannon Priem
Lead PM
"I know that we are able to impact our key business metrics in a positive way with Statsig. We are definitely heading in the right direction with Statsig."
Partha Sarathi
Director of Engineering
"Working with the Statsig team feels like we're working with a team within our own company."
Jeff To
Engineering Manager
"[Statsig] enables shipping software 10x faster, each feature can be in production from day 0 and no big bang releases are needed."
Matteo Hertel
Founder
"Statsig has been an amazing collaborator as we've scaled. Our product and engineering team have worked on everything from advanced release management to custom workflows to new experimentation features. The Statsig team is fast and incredibly focused on customer needs - mirroring OpenAI so much that they feel like an extension of our team."
Chris Beaumont
Data Scientist
"The ability to easily slice test results by different dimensions has enabled Product Managers to self-serve and uncover valuable insights."
Preethi Ramani
Chief Product Officer
"We decreased our average time to decision made for A/B tests by 7 days compared to our in-house platform."
Berengere Pohr
Team Lead - Experimentation
"Statsig is a powerful tool for experimentation that helped us go from 0 to 1."
Brooks Taylor
Data Science Lead
"We've processed over a billion events in the past year and gained amazing insights about our users using Statsig's analytics."
Ahmed Muneeb
Co-founder & CTO
"Leveraging experimentation with Statsig helped us reach profitability for the first time in our 16-year history."
Zachary Zaranka
Director of Product
"Statsig enabled us to test our ideas rather than rely on guesswork. This unlocked new learnings and wins for the team."
David Sepulveda
Head of Data
"Brex's mission is to help businesses move fast. Statsig is now helping our engineers move fast. It has been a game changer to automate the manual lift typical to running experiments and has helped product teams ship the right features to their users quickly."
Karandeep Anand
President
"We only had so many analysts. Statsig provided the necessary tools to remove the bottleneck. I know that we are able to impact our key business metrics in a positive way with Statsig. We are definitely heading in the right direction with Statsig."
Partha Sarathi
Director of Engineering
"Statsig has been a game changer for how we combine product development and A/B testing. It's made it a breeze to implement experiments with complex targeting logic and feel confident that we're getting back trusted results. It's the first commercially available A/B testing tool that feels like it was built by people who really get product experimentation."
Joel Witten
Head of Data
"We realized that Statsig was investing in the right areas that will benefit us in the long-term."
Omar Guenena
Engineering Manager
"Having a dedicated Slack channel and support was really helpful for ramping up quickly."
Michael Sheldon
Head of Data
"Statsig takes away all the pre-work of doing experiments. It's really easy to setup, also it does all the analysis."
Elaine Tiburske
Data Scientist
"We thought we didn't have the resources for an A/B testing framework, but Statsig made it achievable for a small team."
Paul Frazee
CTO
"We use Statsig's analytics to bring rigor to the decision-making process across every team at Wizehire."
Nick Carneiro
CTO
"We've successfully launched over 600 features behind Statsig feature flags, enabling us to ship at an impressive pace with confidence."
Wendy Jiao
Staff Software Engineer
"We chose Statsig because it offers a complete solution, from basic gradual rollouts to advanced experimentation techniques."
Carlos Augusto Zorrilla
Product Analytics Lead
"We have around 25 dashboards that have been built in Statsig, with about a third being built by non-technical stakeholders."
Alessio Maffeis
Engineering Manager
"Statsig beats any other tool in the market. Experimentation serves as the gateway to gaining a deeper understanding of our customers."
Toney Wen
Co-founder & CTO
"We finally had a tool we could rely on, and which enabled us to gather data intelligently."
Michael Koch
Engineering Manager
"At Notion, we're continuously learning what our users value and want every team to run experiments to learn more. It's also critical to maintain speed as a habit. Statsig's experimentation platform enables both this speed and learning for us."
Mengying Li
Data Science Manager
"At OpenAI, we want to iterate as fast as possible. Statsig enables us to grow, scale, and learn efficiently. Integrating experimentation with product analytics and feature flagging has been crucial for quickly understanding and addressing our users' top priorities."
Dave Cummings
Engineering Manager, ChatGPT
"Statsig has helped accelerate the speed at which we release new features. It enables us to launch new features quickly & turn every release into an A/B test."
Andy Glover
Engineer
"We knew upon seeing Statsig's user interface that it was something a lot of teams could use."
Laura Spencer
Chief of Staff
"The beauty is that Statsig allows us to both run experiments, but also track the impact of feature releases."
Evelina Achilli
Product Growth Manager
"Statsig is my most recommended product for PMs."
Erez Naveh
VP of Product
"Statsig helps us identify where we can have the most impact and quickly iterate on those areas."
John Lahr
Growth Product Manager
"With Warehouse Native, we add things on the fly, so if you mess up something during set up, there aren't any consequences."
Jared Bauman
Engineering Manager - Core ML
"In my decades of experience working with vendors, Statsig is one of the best."
Laura Spencer
Technical Program Manager
"Statsig is a one-stop shop for product, engineering, and data teams to come together."
Duncan Wang
Manager - Data Analytics & Experimentation
"Engineers started to realize: I can measure the magnitude of change in user behavior that happened because of something I did!"
Todd Rudak
Director, Data Science & Product Analytics
"For every feature we launch, Statsig saves us about 3-5 days of extra work."
Rafael Blay
Data Scientist
"I appreciate how easy it is to set up experiments and have all our business metrics in one place."
Paulo Mann
Senior Product Manager