New & Improved Custom Queries
✨ New & Improved Custom Queries
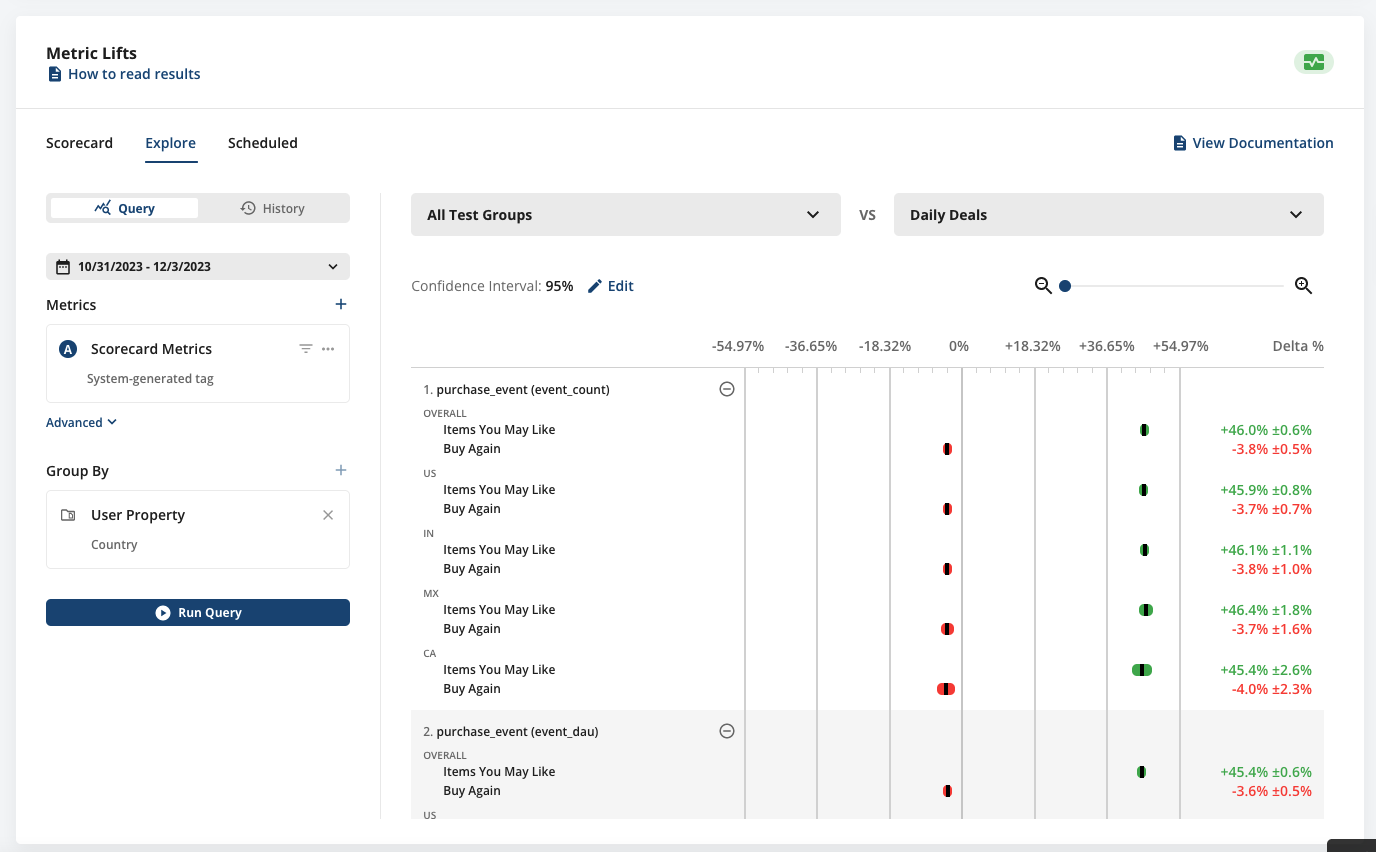
Today, we’re starting to roll out a complete refresh of our Custom Queries feature. Here’s what’s changing:
Performance-Custom Queries are a key part of analyzing your experiment results. We’ve brought down query time from 10-15 minutes to 2-3 minutes, speeding up your iteration cycle times and ensuring you can get to the answer you’re looking for faster.
Query UX- We’ve completely overhauled the Custom Query UX to feel closer to our MEX query UX, so this should feel like a familiar interface to navigate!
Filter/ Group by Event Dimensions- In addition to filtering/ grouping by User Dimensions, we’ve added the ability to filter/ group by Event Dimensions.
Improved Detail View- Now, you can see the details of your Custom Query Pulse results via a hovercard similar to what you see in the Scorecard, with raw stats, time-series (coming soon), and topline projected impact.
Some aspects of Custom Queries are remaining the same, such as the ability to save, name, and share your historical queries, as well as the ability to schedule a Custom Query to run daily in the “Scheduled” tab.
Read more about the new Custom Queries product here, and let us know if you have any feedback!

Loved by customers at every stage of growth


