Products
Solutions
Resources
🧭 Warehouse Explorer

🧭 Warehouse Explorer
Overview
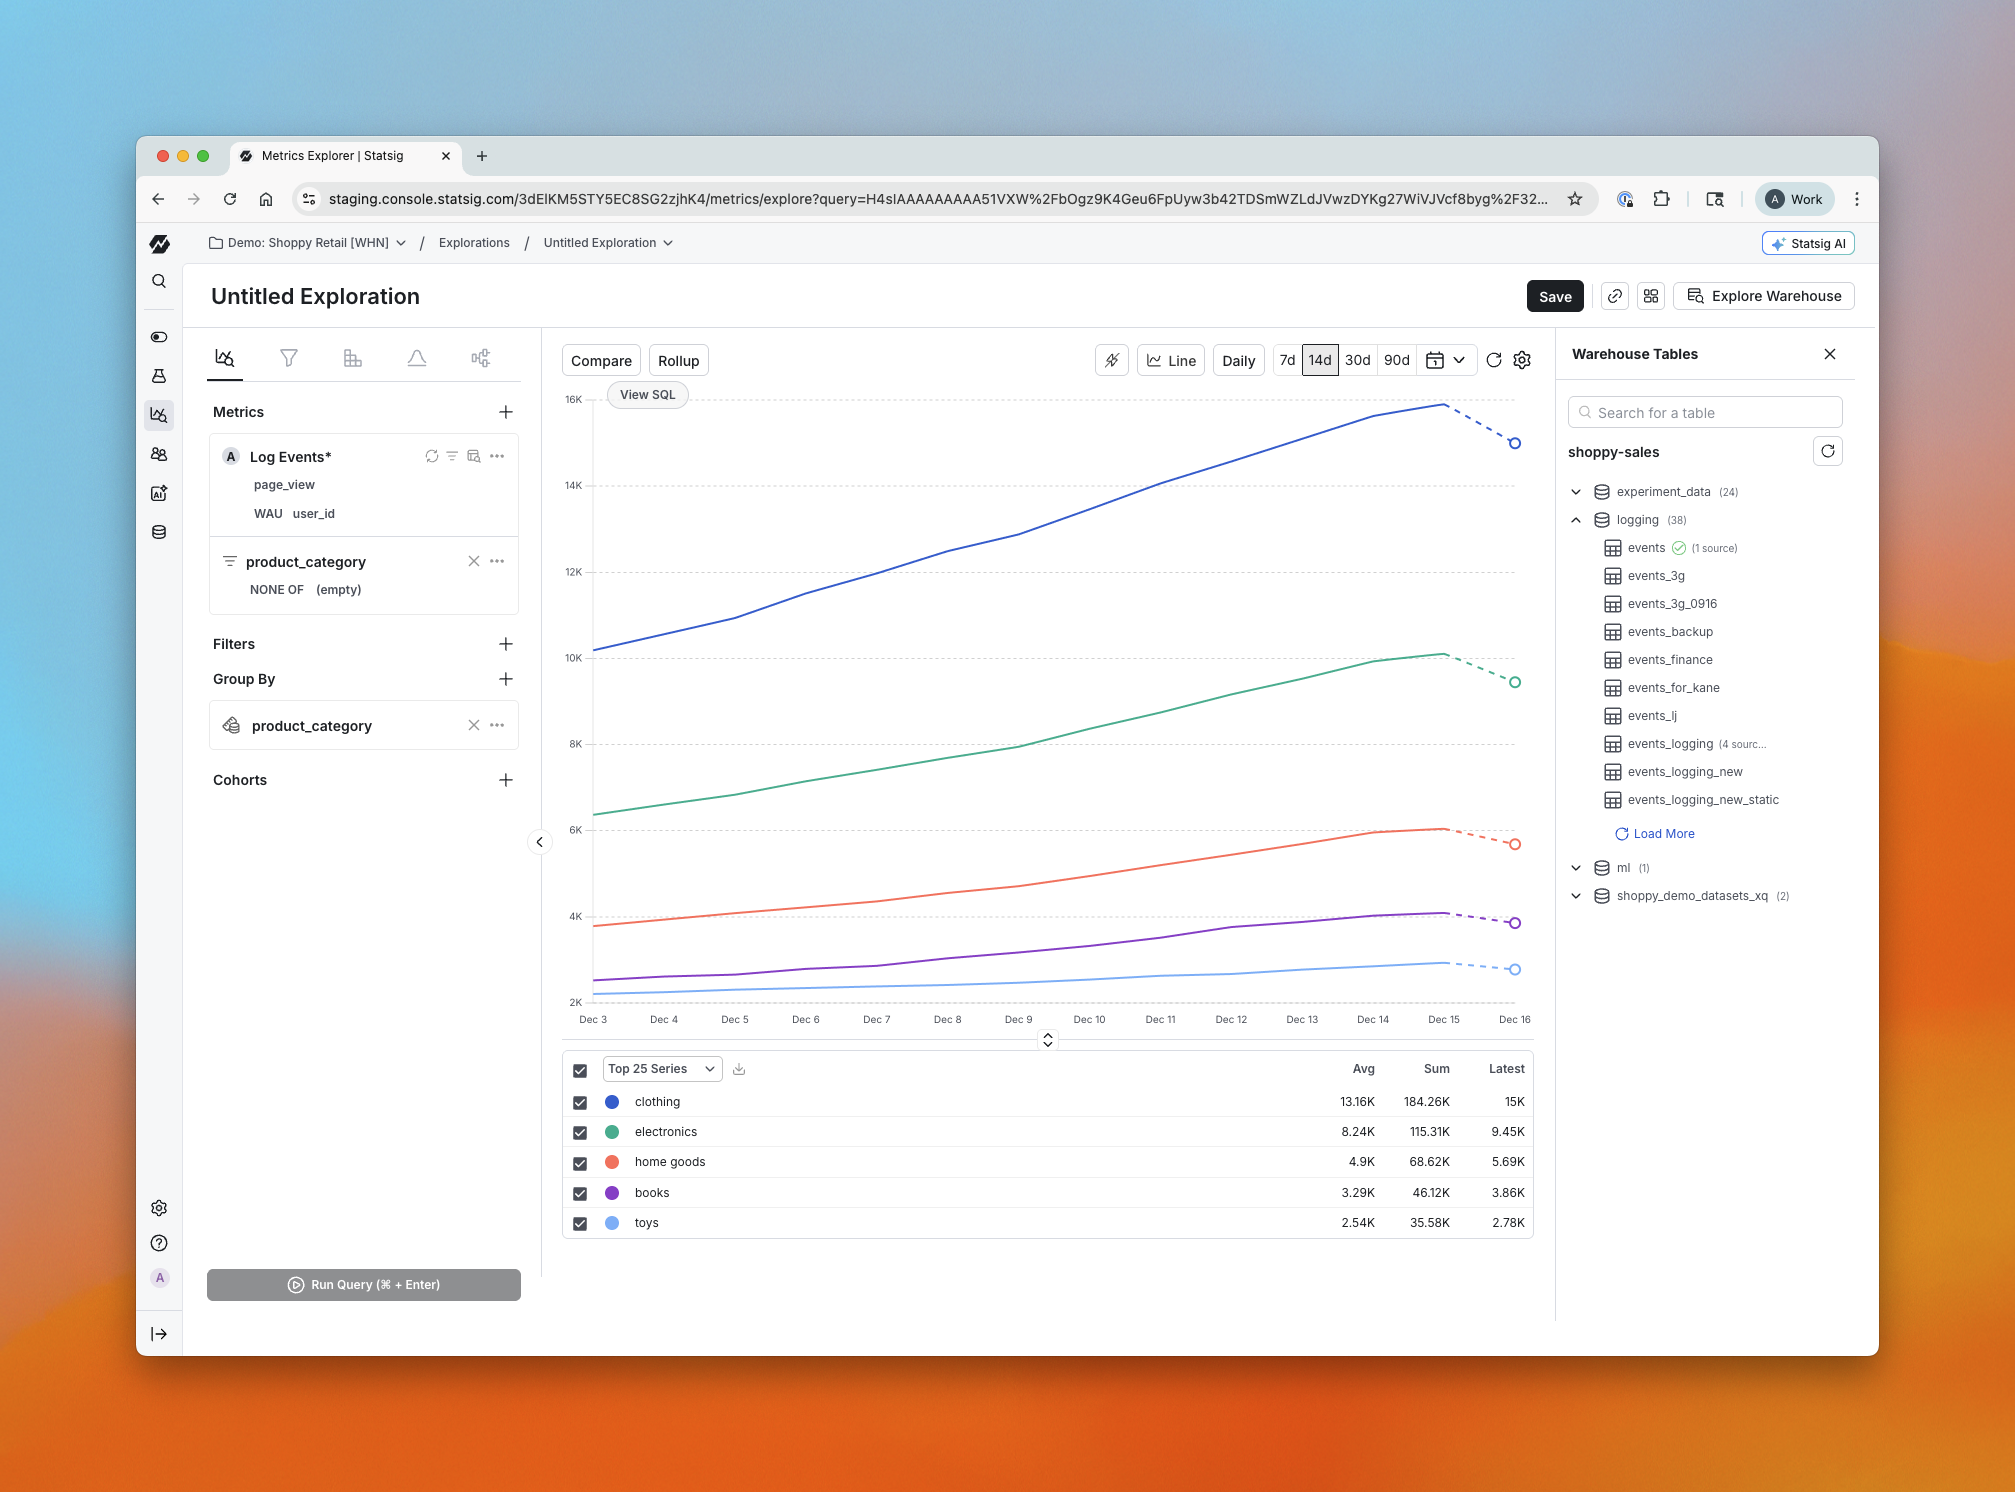
Warehouse Explorer makes it easy to bring warehouse data into Statsig, without needing to know the “right” table upfront. Previously, if you wanted to analyze warehouse data in Statsig, you had to know the name, location, and schema of the table and configure a metric source for it. Now, Metrics Explorer includes a visual browser for your warehouse projects, folders, and tables so you can discover what you need first, then add it for analysis. This is a new capability and is only available for Warehouse Native customers.
What You Can Do Now
Browse your warehouse projects, folders, and tables directly in Statsig
Click into any table to quickly understand what’s inside:
Column names
Sample values for each column
Per-value row distribution metadata (what percent of rows each value represents)
Bring a table into Statsig for analysis in a few clicks:
Name the source
Provide light configuration (for example, whether it’s an event-based table)
Build self-serve visualizations from warehouse data faster, like:
Funnels from GA4 tables
Exploring Stripe data without manual setup work
How It Works
Open Metrics Explorer and browse through your warehouse projects and folders.
Select a table to preview its schema, sample values, and distribution metadata.
When you find the table you want, name it and complete a small amount of configuration (for example, mark whether it’s event-based).
Start analyzing the table in Statsig right away.
Impact on Your Analysis
Faster time to first chart because you can discover tables inside Statsig instead of tracking them down elsewhere
More self-serve exploration for teams with lots of warehouse datasets
Easier setup for common workflows like funnels and business-data analysis
Warehouse Explorer is available today for all Warehouse Native Analytics customers.