Products
Solutions
Resources


CUPED is slowly becoming a common term in online experimentation since its coining by Microsoft in 2013.
Meaning Controlled-experiment Using Pre-Experiment Data, CUPED is frequently cited as—and used as—one of the most powerful algorithmic tools for increasing the speed and accuracy of experimentation programs.
In this article, we’ll:
Cover the background of CUPED
Illustrate the core concepts behind CUPED
Show how you can leverage this tool to run faster and less biased experiments
What CUPED solves:
As an experiment matures and hits its target date for readout, it’s not uncommon to see a result that seems to be only barely outside the range where it would be treated as statistically significant. In a frequentist world, this isn’t sufficient evidence that your change caused a change in user behavior.
If there was a real effect, you needed more sample size to increase your chances of getting a statistically significant result. In an experiment, the standard error or “noise” goes down with the square root of your sample size. However, sample size is an expensive resource, usually proportional to the enrollment window of your experiment.
Waiting for more samples delays your ability to make an informed decision, and it doesn’t guarantee you’ll observe a statistically significant result when there is a real effect.
Even at companies with immense scale like Facebook and Amazon, people have to deal with the pain of waiting for experiments to enroll users and mature because they’re usually looking for relatively small effects.
Consider this: A 0.1% increase to revenue at Facebook is worth upwards of $100 million per year!
For smaller companies, small effect sizes can become infeasible to measure. It would just take too long to get the sample needed to reliably observe a statistically significant change in their target metric.
Because of this cost, a number of methods have been developed in order to decrease the standard error for the same metric and sample size.
CUPED is an extremely popular implementation that uses pre-experiment data to explain away some of the variance in the result data.
The statistical concept behind CUPED
Like many things in experimentation, the core concept behind CUPED is simple, but its implementation can be tricky (and expensive!).
The guiding principle of CUPED is that not all variance in an experiment is random. In fact, a lot of the differences in user outcomes are based on pre-existing factors that have nothing to do with the experiment.
Let’s talk about this for a minute:
Say we want to run a test to see if people run slower with weights attached to them. From a physics perspective, the answer seems pretty obvious. We might record data like this:
| Person | Test Group | Experiment Mile Time |
|---|---|---|
| Sally | Weights | 6:40 |
| Dave | No Weights | 7:10 |
| Jane | Weights | 8:20 |
| Bob | No Weights | 9:00 |
If we average out our results, we might clearly see the expected effect, but we might not; there’s a lot of variance and overlap in the observed mile times. It should be pretty clear, however, that how fast the runners already were might be an underlying factor. What if we asked them to run a mile a week ago to establish a baseline?
| Person | Group | Baseline Mile Time | Experiment Mile Time | Change |
|---|---|---|---|---|
| Sally | Weights | 6:30 | 6:40 | +10 |
| Dave | No Weights | 7:08 | 7:10 | +2 |
| Jane | Weights | 7:30 | 8:20 | +50 |
| Bob | No Weights | 9:15 | 9:00 | -15 |
In the context of their “typical” mile time, this effect should be much clearer! We’ve implicitly switched from caring about their raw “mile time” into caring about the difference from what we’d expect!
By doing this, we’ve also “explained” some of the noise and variance in the experiment metric. Before, we saw a difference of 140 seconds between the fastest and slowest runner. Now, we’ve reduced the range in our metric to 65 seconds; this lower range should mean that the variance we’d use to calculate confidence intervals and p-values will be lower.
This is conceptually very similar the original implementation of CUPED; we use the pre-experiment data for a metric to normalize the post-experimental values. How much we normalize is based on how well the pre-experiment data predicts the experiment data - we’ll dive into this later.
Bias correction
Because experimental groups are randomly assigned, there’s a chance that the two groups randomly have different baseline run times. If you’re unlucky, that difference could even be statistically significant. This means that even if the weights did nothing, you might conclude that there’s a difference between the two groups.
If you have access to that baseline data, it’d be possible to conclude that there was a pre-existing difference and be wary of the results. In the example below, it’s pretty obvious that the difference in the groups before the test would make the results extremely skewed:
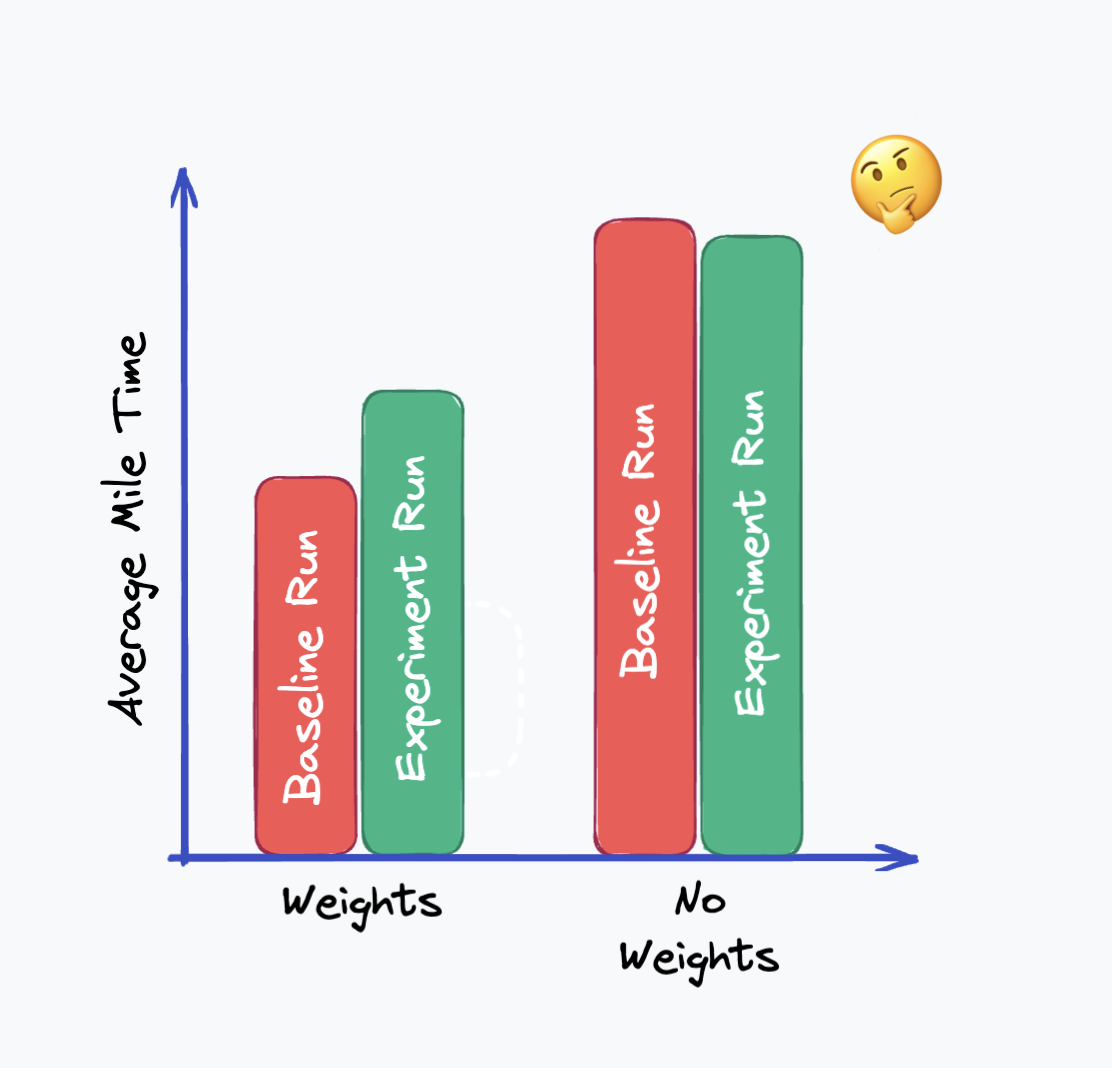
You might note that you can see that the weighted runners’ times went up, and the unweighted runners’ times went down. This relative change does match our expectation. Would it be possible to infer that there is an effect here? Correcting this data with CUPED can help!
Correction
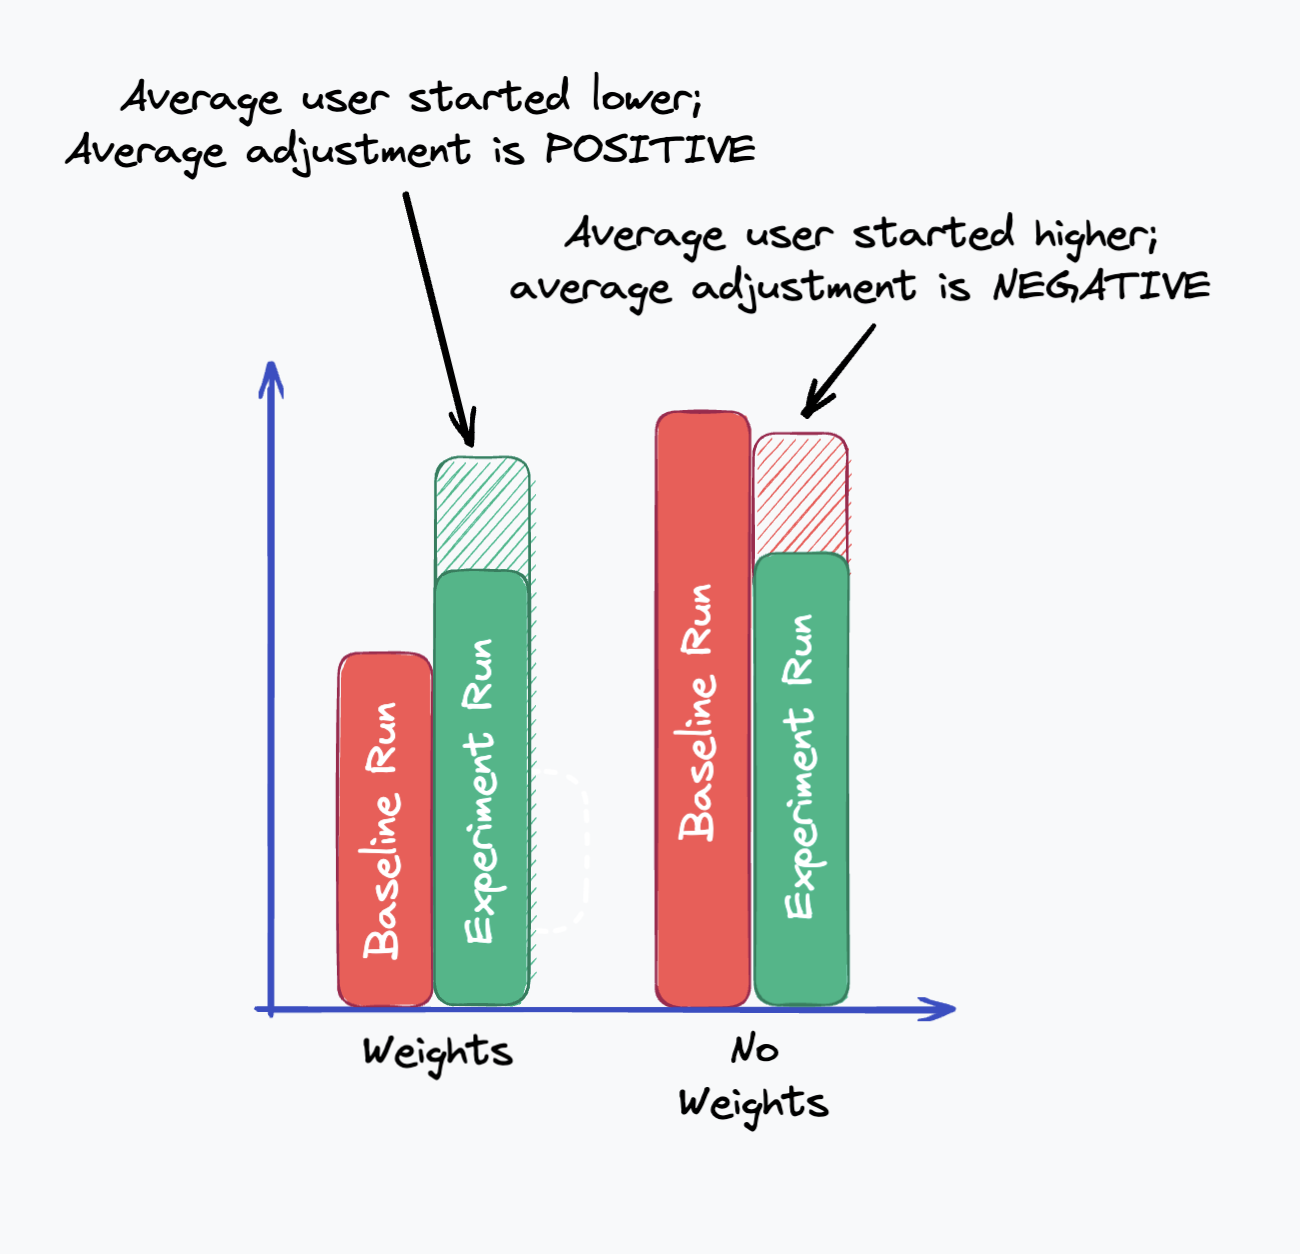
Conceptually, if one group has a faster average baseline, their experiment results will also be faster. When we apply a CUPED correction, the faster group’s metric will be adjusted downwards relative to the slower group.
In this example, the post-adjustment averages might move something like this, pushing the weights group’s experiment value higher than the control group. We could follow up with a statistical test to understand if the difference in adjusted values is statistically significant.
Stratification
Some variants of CUPED are ‘non-parametric’ or ‘bucketed’. What this usually means is that (in this example) we would split users into groups based on their pre-experiment run times, and measure metrics relative to the average metric value of that group.
For example, consider the data below - this is for the bucket of users who ran between a 6:30 and 6:40 mile in the baseline:
| Group | Prev Mile Time Bucket | Avg Bucket Time | Experiment Mile Time | Adjusted Mile Time |
|---|---|---|---|---|
| Weights | 6:30-6:40 | 6:42 | 6:50 | +8 |
| No Weights | 6:30-6:40 | 6:42 | 6:35 | -7 |
| Weights | 6:30-6:40 | 6:42 | 7:02 | +20 |
Other variables
More complex implementations of CUPED don’t just rely on a single historical data point for the same metric. They can pull in other information as well, as long as it’s independent of the experiment group the user is in.
In the example above, we could add age group as a factor in the experimentation. This has relatively little to do with our experiment, but could be a major factor in people’s mile times! By including this as a factor in CUPED, we can reduce even more variance.
| Group | Baseline Mile Time | Age | Experiment Mile Time | Change |
|---|---|---|---|---|
| Weights | 6:30 | 25 | 6:40 | +10 |
| No Weights | 7:08 | 32 | 7:10 | +2 |
| Weights | 7:30 | 22 | 8:20 | +50 |
| No Weights | 9:15 | 45 | 9:00 | -15 |
Ready to use CUPED?

Using CUPED in practice
In practice, we can’t just subtract out a user’s prior values from their experimental values. The reason for this is also conceptually simple—people’s past behavior isn’t always a perfect predictor for their future behavior.
A mental model for the math we’ll use
Before we go further, it’s useful to understand the relationship between experimentation and regression (the ordinary-least-squares or “OLS” regression you’d run in excel.)
A T-test for a given metric is mathematically equivalent to running a regression where the dependent variable is your metric and the independent variable is a user’s experiment group. To demonstrate this, I generated some data for the example experiment above, where users’ paces are based on a randomly-assigned baseline pace and if they’re in the test group.
The population statistics for this are:
Let’s compare the outputs of running a T-test and running an OLS where we use the 1-or-0 test flag as the independent variable.
T-test:
OLS:
Comparing these, we notice a lot of similarities:
The effect size in our T-test (the delta between test and control) is exactly the same as the “test” variable’s coefficient in the OLS regression.
The standard error for the coefficient is the same as the standard error for our T-test.
The p-value for the “test” variable coefficient is the same as for our t-test!
In short, our standard T-test is basically a regression against a 1-or-0 variable!

When we want to make regressions more accurate, we might add relevant explanatory variables. We can do the same for our test; again, this is the core concept behind CUPED.
Let’s include baseline pace as a factor in our regression. We should expect this to change the regression quite a bit, since it’s such a powerful explanatory variable—and it does.
Let’s review:
The “test” variable’s coefficient (the estimate of the experiment effect) didn’t change much. That’s expected - unless there was a significant difference between the groups before the experiment we should get a similar estimate of the experiment effect.
The standard error (and accordingly p-value) went down from 4.73 to 2.13. This is because a lot of the noise we previously attributed to our test variable wasn’t random: Tt was coming from users having different baselines, which we’re now accounting for!
Our p-value goes from 0.116 to 0.000 because of the decreased Standard Error. The result, which was previously not statistically significant, is now clearly significant.
Using CUPED with the baseline pace achieves nearly-identical results. To visualize the reduction in Variance/Standard Error, I plotted the distribution of user paces from this sample dataset before and after I applied CUPED:
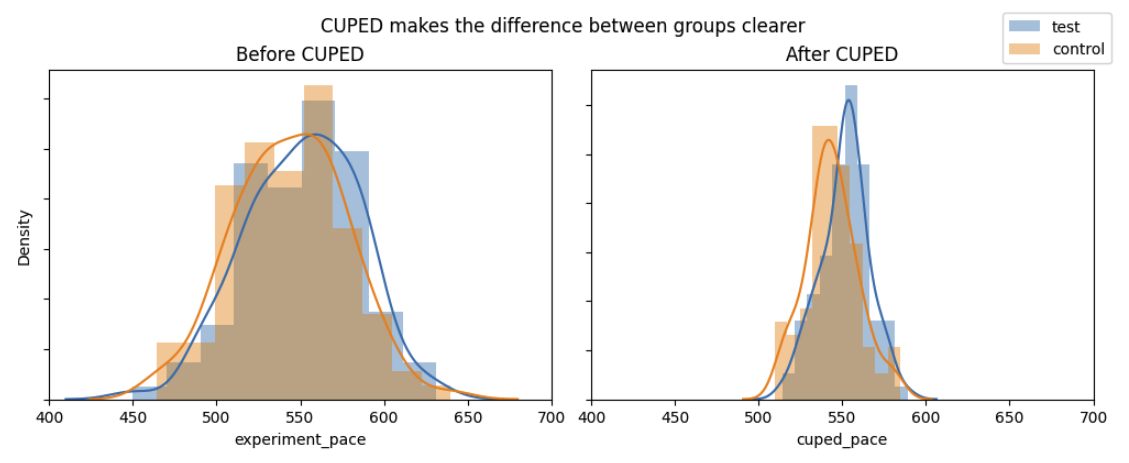
When we apply CUPED, we see a large reduction in variance and p-value, just like in the regression results. Using the pre-experiment data reduced the variance, p-value, and the data we would need to consistently see this result.
Get a demo of CUPED

CUPED math and implementation
For more details on this, please refer to the 2013 Microsoft white paper. We’ve used many formulas that appear in that paper here.
To reduce variance by using other variables, we’ll need to make adjustments such that we end up with an unbiased estimator of group means that we’ll use in our calculations. An unbiased estimator simply means that the expected value of the estimator is equal to the true value of the parameter we’re estimating.
In practice, this means we need to pick an adjustment that is independent of which test group a user is assigned to.
For the original, simplest implementation of CUPED we’ll refer to our pre-experiment values as X and our experiment values as Y. We’ll adjust Y to get a covariate-adjusted Ycv according to the formula below:
\[ \hat{Y}_{cv} = \overline{Y} - \theta \overline{X} + \theta \mathbb{E}(X) \]
Here, θ could be any derived constant. What this equation means it that, for any θ, we can take two steps:
Multiply the pre-experiment population mean by θ and add it to each user’s result
Subtract from each user’s result θ multiplied by their pre-experiment value
This gives us an unbiased estimator Ycv which factors in the covariate into our estimates. We can calculate the variance of the new estimator term:
\[ \begin{align*} \text{var}(\hat{Y}_{cv}) &= \text{var}(\hat{Y} - \theta \hat{X}) \\ &= \frac{\text{var}(\hat{Y} - \theta {X})}{n} \\ &= \frac{1}{n} \left( \text{var}({Y}) + \theta^2 \text{var}({X}) - 2 \theta \text{cov}(X, Y) \right) \end{align*} \]
This is the variance of our adjusted estimator for Y. This variance turns out to be the smallest for:
\[ \theta = \frac{\text{cov}(Y, X)}{\text{var}(X)} \]
This is the term we’d use to calculate the slope in an OLS regression! This is also the term we’ll up using in our data transformation - we take all the data in the experiment and calculate this theta. The final variance for our estimator is
\[ \text{var}(\hat{Y}_{cv}) = \text{var}(\bar{Y})(1 - \rho^2) \]
where ρ is the correlation between X and Y. The correlation between the pre-experiment and post-experiment data is directly linked to how much the variance is reduced. Note that since ρ is bounded between [-1, 1], this new variance will always be less than or equal to the original variance.
In practice
To create a data pipeline for the basic form of CUPED, you need to carry out the following steps. With X referring to pre-experiment data points and Y points referring to experiment data:
Calculate the covariance between Y and X as well as the variance and mean of X. Use this to calculate θ per the formula above.
This requires that users without pre or post-experiment data are included as 0s if they are to be included in the adjustment
For each user, calculate the user’s individual pre-experiment value. It’s common to choose to not apply an adjustment for users who are not eligible for pre-experiment data (for example new users) - this is effectively a one-level striation.
Join the population statistics to the user-level data
Calculate user’s adjusted terms as Y +θ*(population mean of X)- θX
Run and interpret your statistical analysis as you normally would, using the adjusted metrics as your inputs
Implications from the CUPED math (above):
There are many covariates we could use for variance reduction; the main requirement is that it is independent of the experiment group which the user is assigned to. Generally, data from before an experiment is safest.
We commonly use the same metric from before the experiment as a covariate because in practice it’s usually a very effective predictor, and it makes intuitive sense in most cases.
We should calculate the group statistics for the pre-experiment/post-experiment data across the entire experiment population—not on a per-group basis—because it’s possible there’s an interaction effect between the treatment and the pre-exposure data. For example, users who run faster may be better equipped to run with weights, and so the correlation between the pre and post-periods would be different than for slower users.
New Users won’t have pre-experiment data. An experiment with no pre-experiment data won’t be able to leverage CUPED. In these cases, the best bet is to use covariates like demographics if possible.
If an experiment has some new users and some established users, you can use CUPED and split the population by another binary covariate: Do they have pre-experiment data or not? Functionally, this means you just apply CUPED only on users with pre-experiment data as discussed above.
CUPED best practices
CUPED is most effective on existing user experiments where you have access to user’s historical data. For new users experiments, stratification or other covariates like demographics can be useful, but you won’t be able to leverage as rich of a covariate.
CUPED needs historical data to work; this means that you need to make sure your metric data goes back to before the start of the pre-experiment data window.
CUPED’s ability to adjust values is based on how correlated a metric is with its past value for the same user. Some metrics will be very stable for the same user and allow for large adjustments; some are noisy over time for the same user, and you won’t see much of a difference in the adjusted values.
Related reading and resources
Request a demo
