Products
Solutions
Resources

The value of experimentation compounds as you run more experiments.
Over the past three years, we’ve seen several companies significantly scale their experimentation culture, often increasing their experimentation velocity by 10-30x within a year.
Whatnot hit a run rate of 400 experiments last year, Notion scaled from single-digit to hundreds per quarter, Rec Room went from nearly zero to 150 experiments in their first year with Statsig, and Lime started testing every change they roll out.

Now as you run more experiments, you generate more data that can be aggregated for deeper insights. The idea is simple: run an experiment to learn, then learn from all the experiments you’ve run! This creates a continuous cycle of new insights and hypotheses generation, powering the experimentation flywheel.
For example, if you’ve spent a quarter testing ways to optimize product recommendations in your e-commerce app, an individual experiment might guide a ship decision. But, when you analyze all your experiments together, you uncover broader insights about your users, metrics, and your experimentation program as a whole—that can guide your roadmap.
How easy is it to influence first-time GMV? How many changes have had a positive impact on this metric? Are there other more easily moved metrics that strongly correlate with it?
Announcing a suite of meta-analysis views
Over the summer, we worked with customers to identify and surface key meta-level insights across your corpus of experiments. We’ve shipped several views to help you drive more learnings and strengthen your experimentation culture.
You don’t need to be running hundreds of experiments to benefit. Valuable insights can start appearing even after running just a few dozen. Below is a summary of views we shipped and you can get started right away by navigating to Experiments > Insights on the left pane of the Statsig console.
1. Experiment timeline view
The experiment timeline view provides a quick snapshot of all the experiments you've run, with the ability to filter down to a team-level view. At a glance, you can answer questions like:
What experiments are running now?
When are they expected to end?
What % of experiments ship Control vs Test?
What is the typical duration?
Do experiments run for their planned duration or much longer or shorter?
Do experiments impact key business metrics or only shallow or team-level metrics?
How much do they impact key business metrics?

This view also features summary stats such as how many experiments shipped control, so you don't have to sit and manually tally stats here.
2. Metric correlation view
Often, the metric you want to move often isn't very sensitive and takes time to measure. It’s helpful to identify metrics that are more sensitive and quicker to measure—and then run experiments on those.

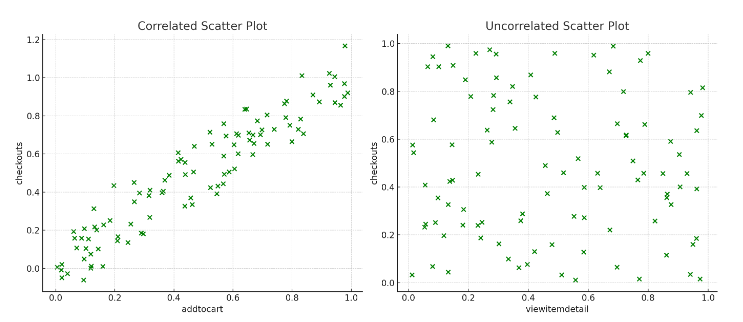
The correlation view allows you to plot two metrics on the same chart, with each data point representing an experiment's impact on both. This helps you quickly determine whether the metrics tend to move together or independently. You can remove outliers, filter by a team's experiments, or download the underlying dataset.
In this hypothetical example, Checkouts is the target metric but isn't very sensitive. However, AddToCart correlates well with Checkouts, while ViewItemDetail does not.
3. Metric impacts
This metric impacts view—also known as the “battering averages” view—shows you how easy or hard it is to move a metric:

This is helpful for setting reasonable goals and sniff-testing claims about the next experiment moving a metric by x%.
You can filter by a set of shipped experiments and see how many moved a metric by 1% versus 10%. As with other meta-analysis views, you can filter by team, tag, or whether the results were statistically significant.
💡Be sure to check out the adjacent “metric insights” view, which lets you see how features impact specific metrics like DAU—identifying which features positively and negatively impact it.
4. Knowledge base
We’ve also introduced the experiment knowledge base: a searchable repository of experiment learnings across teams. While the meta-analysis views offer a structured way to glean insights across experiments, the knowledge base is ideal for free-text search.
It ensures that learnings are documented and accessible to everyone in the organization. It’s a great tool for new team members to explore past experiments or see where specific topics were discussed—helping preserve and share learnings company-wide.
This not only promotes an experimentation culture but also sparks new ideas to test.

Check out all these views right away, and feel free to reach out to us on Slack if you have any feedback or ideas for meta-analysis.
Request a demo
