Enhanced Formulas in Metrics Explorer
Enhanced Formulas in Metrics Explorer
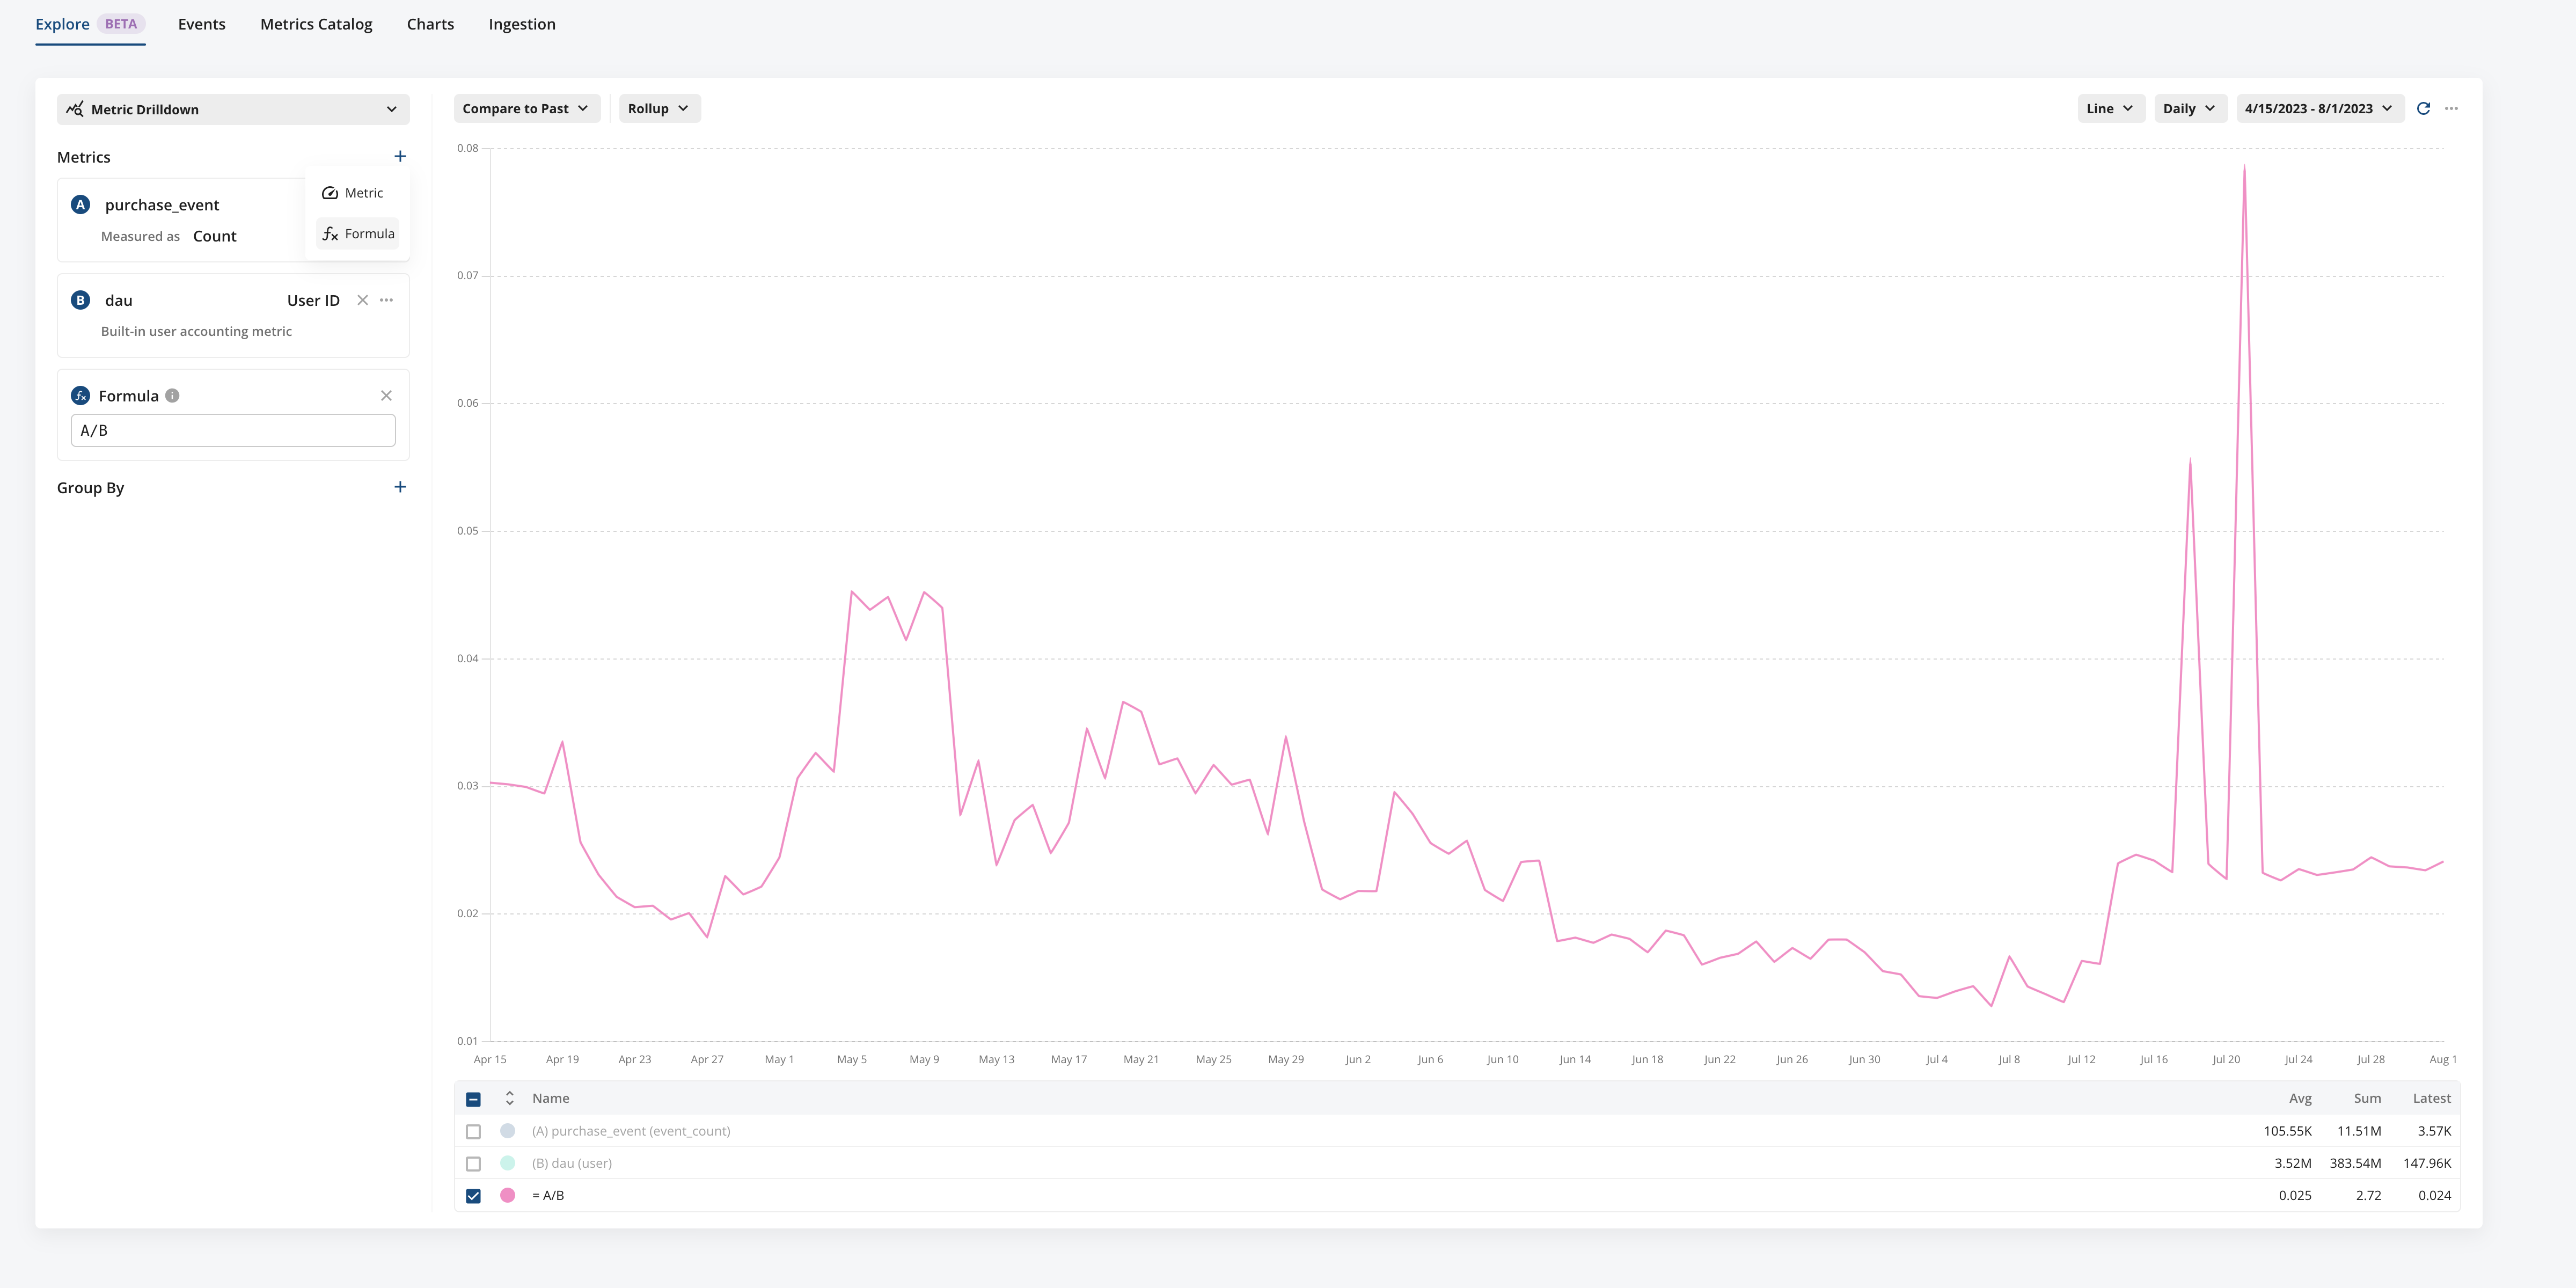
We are happy to announce that you can now do math with your metrics! Metrics Explorer now features new formula capabilities, empowering you to delve deeper into your data with ease.
With this new functionality, you can instantly create and visualize dynamic combinations and transformations of one or more metrics. Whether you're calculating event frequency per user, exploring the relationship between different metrics, or requiring a logarithmic perspective of your data, these insights are now just a few clicks away.
Our enhanced formulas include basic mathematical operations, logarithmic functions, square roots, and more (see our full range here). Moreover, you can now effortlessly add trendlines to your analysis, and any metric in your query can seamlessly integrate as a variable in your formula.
Ready to transform your data analysis? Simply hover over the “+” sign in the Metrics Explorer to start adding and experimenting with formulas.

Loved by customers at every stage of growth


