Experiment Setup Configuration UX, Automated A/A Test Reports, and more
Experiment Setup Configuration UX, Automated A/A Test Reports, and more!
Happy FRIDAY, Statsig Community! We've made it to the end of the week, which means it's time for another set of product launch announcements!
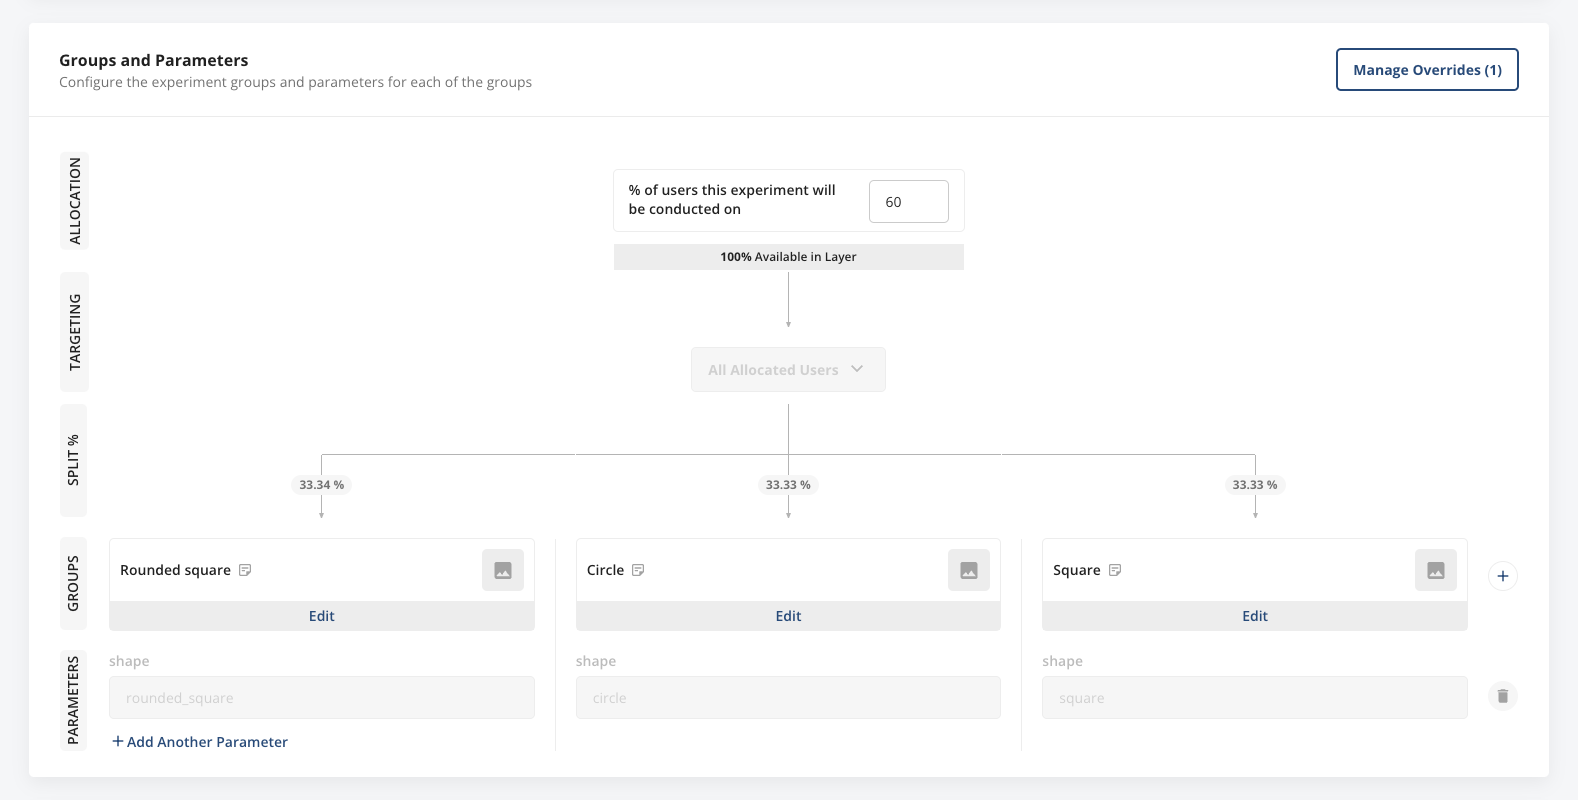
New Experiment Setup Configuration UX
Today, we’re excited to debut a sleek new configuration UX for experiment groups and parameters. Easily see your layer allocation, any targeting gates you’re using, experiment parameters, groups, and group split percentages in one, clear visual breakdown.
We believe this will make setting up experiments more intuitive for members of your team who are newer to Statsig, as well as give experiment creators and viewers alike an intuitive overview of how the experiment is configured.

Automated A/A Test Reports
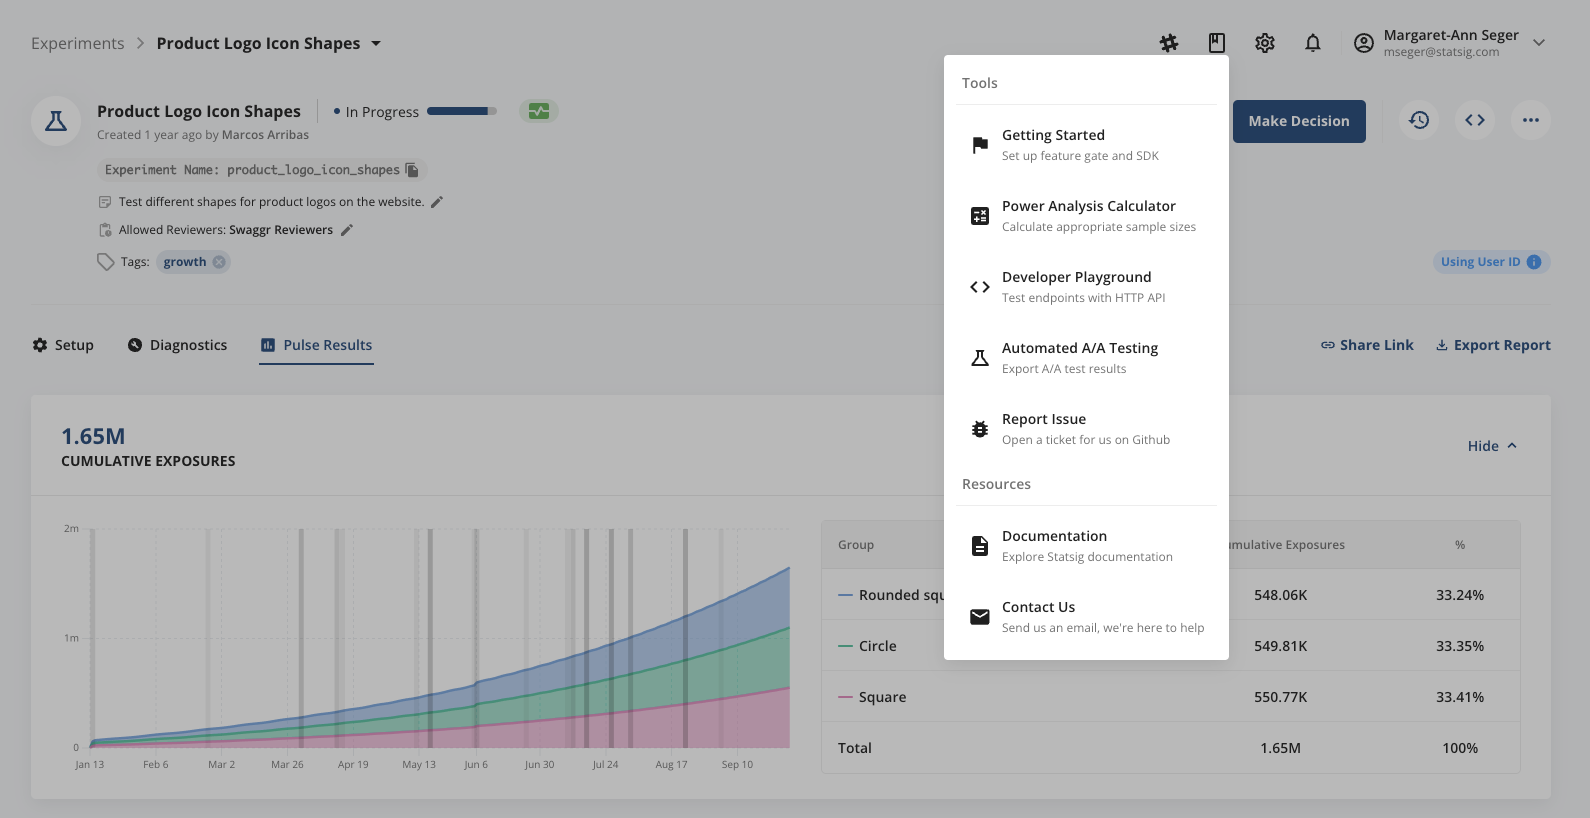
It’s oftentimes considered best practice to regularly ensure the health of your stats engine and your metrics by running periodic A/A tests. We’ve made running these A/A tests at scale easy by setting up simulated A/A tests that run every day in the background, for every company on the platform. Starting today, you can download the running history of your simulated A/A test performance via the “Tools” menu in your Statsig Console.
We run 10 tests/ day, and the download will include your last 30 days of test results. Please note that we only started running these simulations ~1 week ago, so a download today will only include ~70 sets of simulation results.

Loved by customers at every stage of growth


