Monitoring Metrics & Explore in Feature Gates
Monitoring Metrics & Explore in Feature Gates, Multiple Metric Dimensions, and Improved Review UX!
Happy Friday, Statsig Community! We have a fun set of launch announcements for y'all this week.... making every last day count as we come up on the last few weeks of 2022!
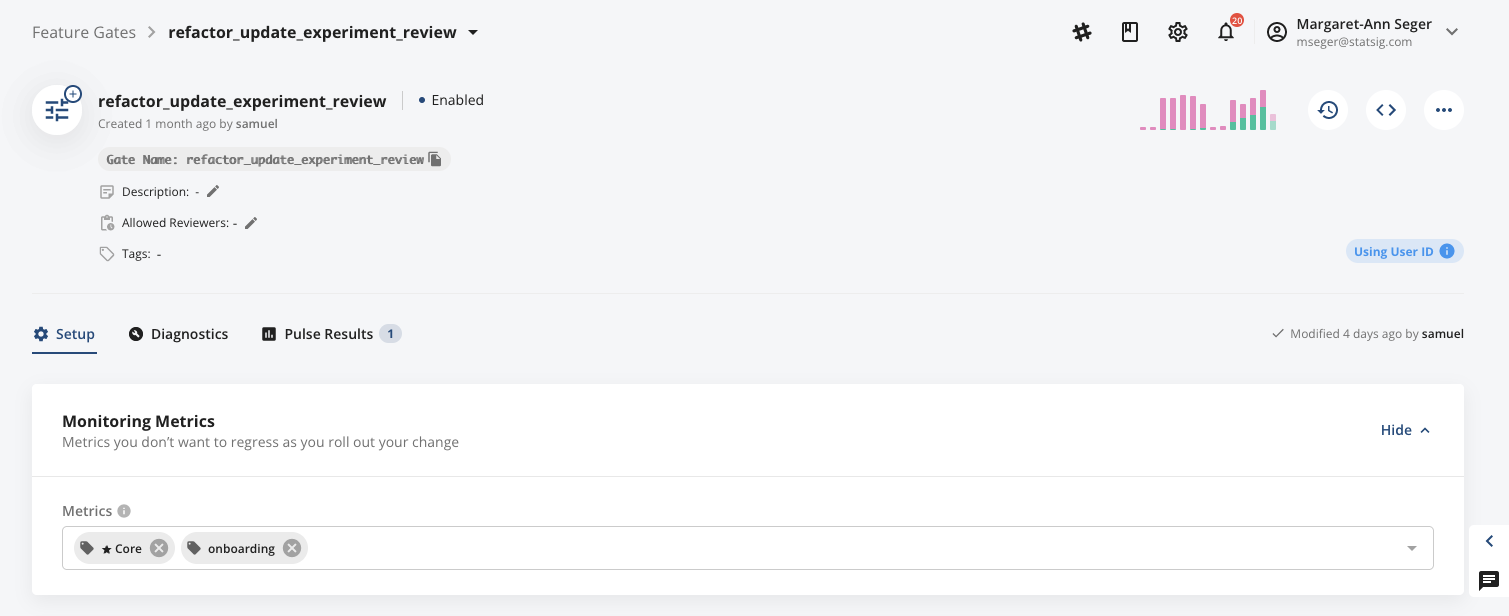
Monitoring Metrics & Explore in Feature Gates
Today, we’re excited to add an explicit section into Feature Gates for Monitoring Metrics. This will enable gate creators to call out any metrics they want to monitor as part of a feature rollout, and make it easier for non-creators to know what launch impact to look for.
Note that by default the Core tag will be auto-added to Monitoring Metrics for all new gate creations.

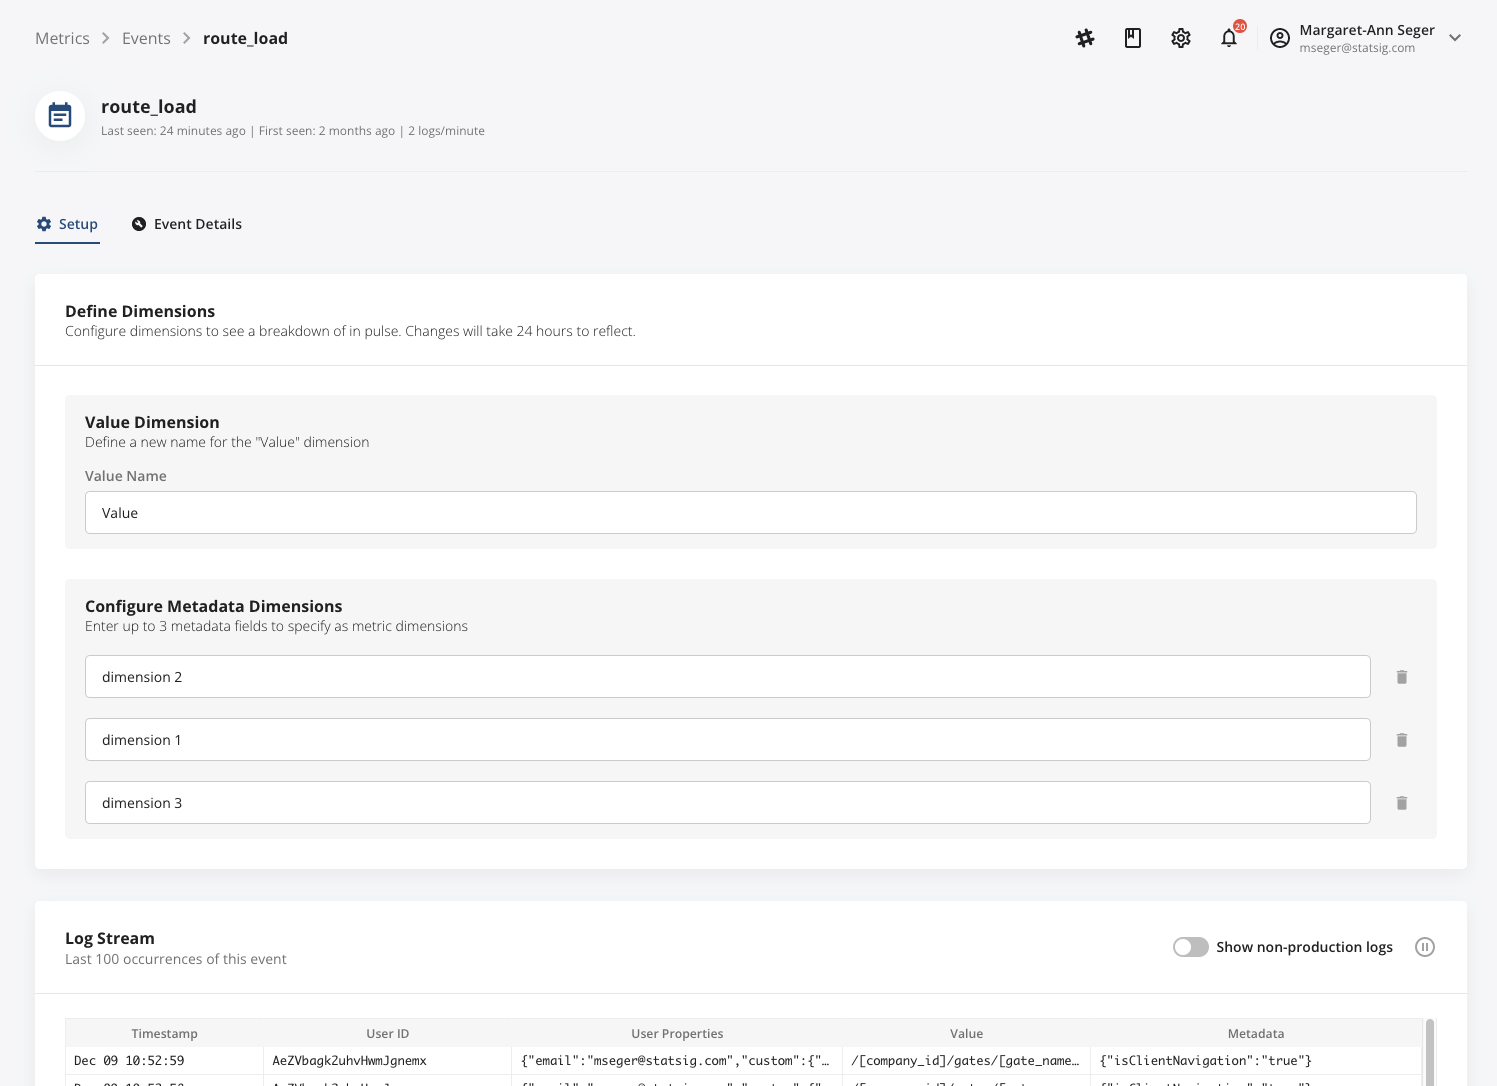
Up to 4 Multiple Metric Dimensions
Historically, we’ve supported sending in a Value and JSON metadata with every logged event, enabling you to break out Pulse results by a metric's Value inline within Pulse.
Today, we’re expanding the number of dimensions you can configure for an event, supporting up to 4 custom dimensions that you can define and send in with events to split your analysis by. To configure custom dimensions for your event, go to the Metrics tab → Events, select the event you want to configure and tap "Setup." Note that you cannot yet configure multiple dimensions for Custom Metrics.

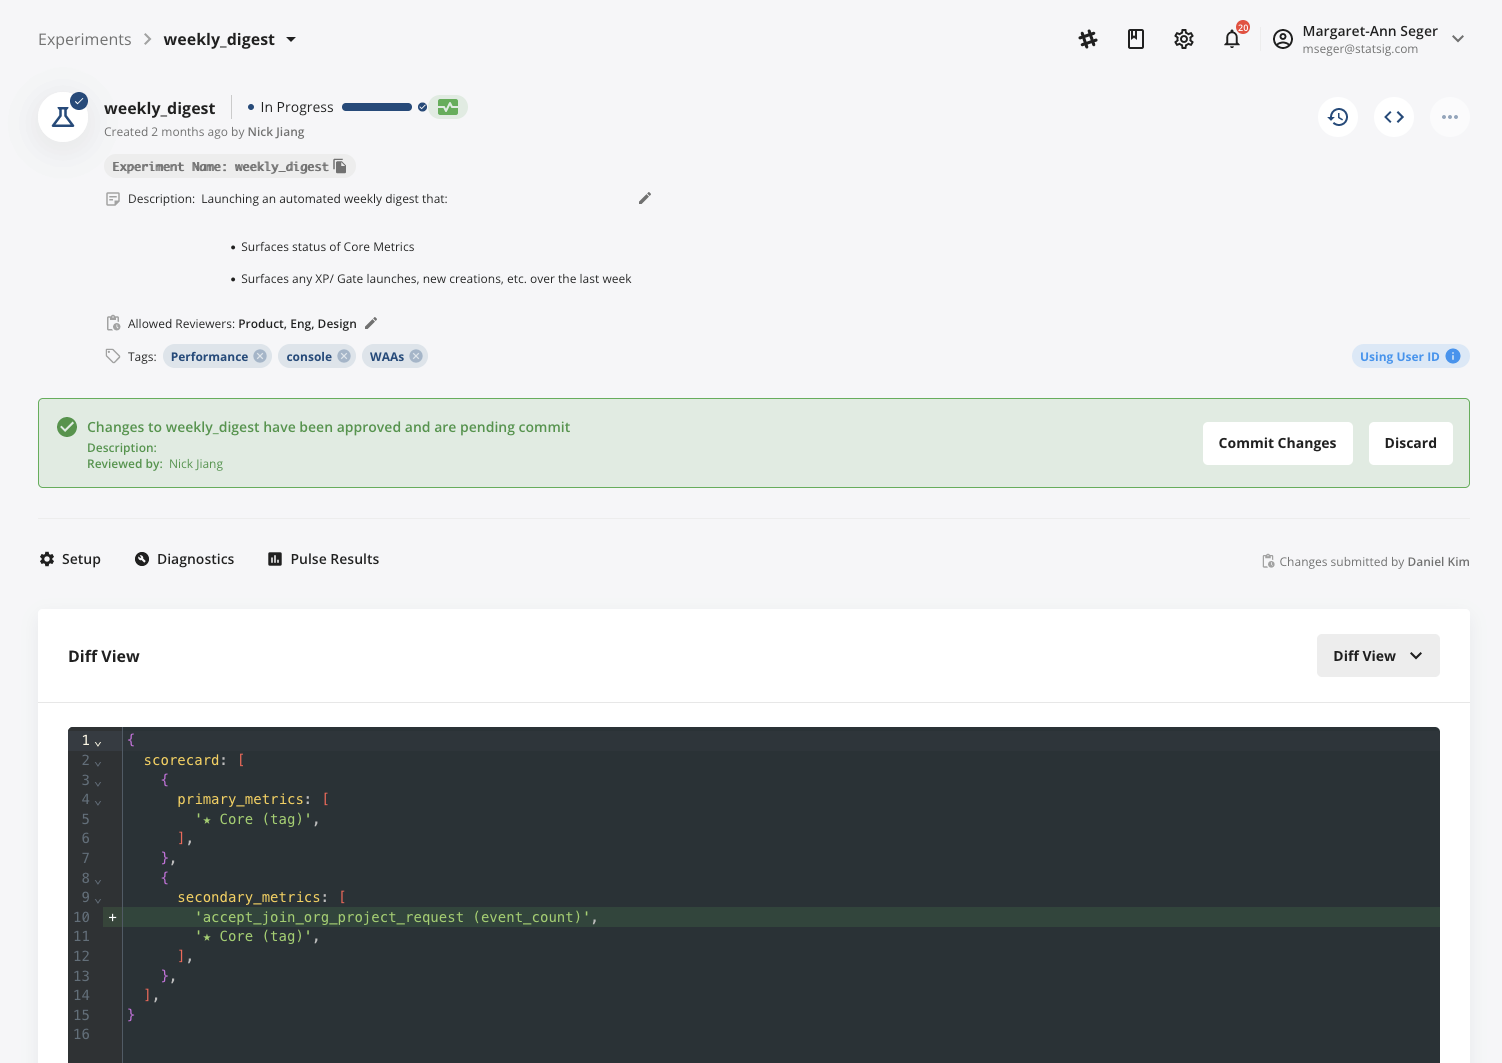
Improved Review UX
Reviewing gate and experiment changes is a core part of the rollout process. Today, we’re making reviews even easier by providing a clearer Before/ After experience to more easily view changes, as well as introducing a new review mode called “Diff View”.
To view changes in Diff View, simply toggle the mode selector in the upper right-hand corner of the review unit from “Visual View” to “Diff View”. Voila!

Loved by customers at every stage of growth


