v1 Dashboards, Discussion Tags, and Advanced Search
v1 Dashboards, Discussion Tags, and Advanced Search (Halloween Edition 🎃)
Happy Monday (and Happy Halloween) Statsig Community! We've got some tricks AND some treats up our sleeve for you today, with an exciting set of new product updates-
v1 Dashboards
You may have noticed a new “Dashboards” tab in the left-hand nav of your Console! Last week, we quietly started rolling out the v1 of our new Dashboards product. Dashboards give you a flexible canvas to build dashboards for the metrics, experiments, and rollouts your team cares most about.
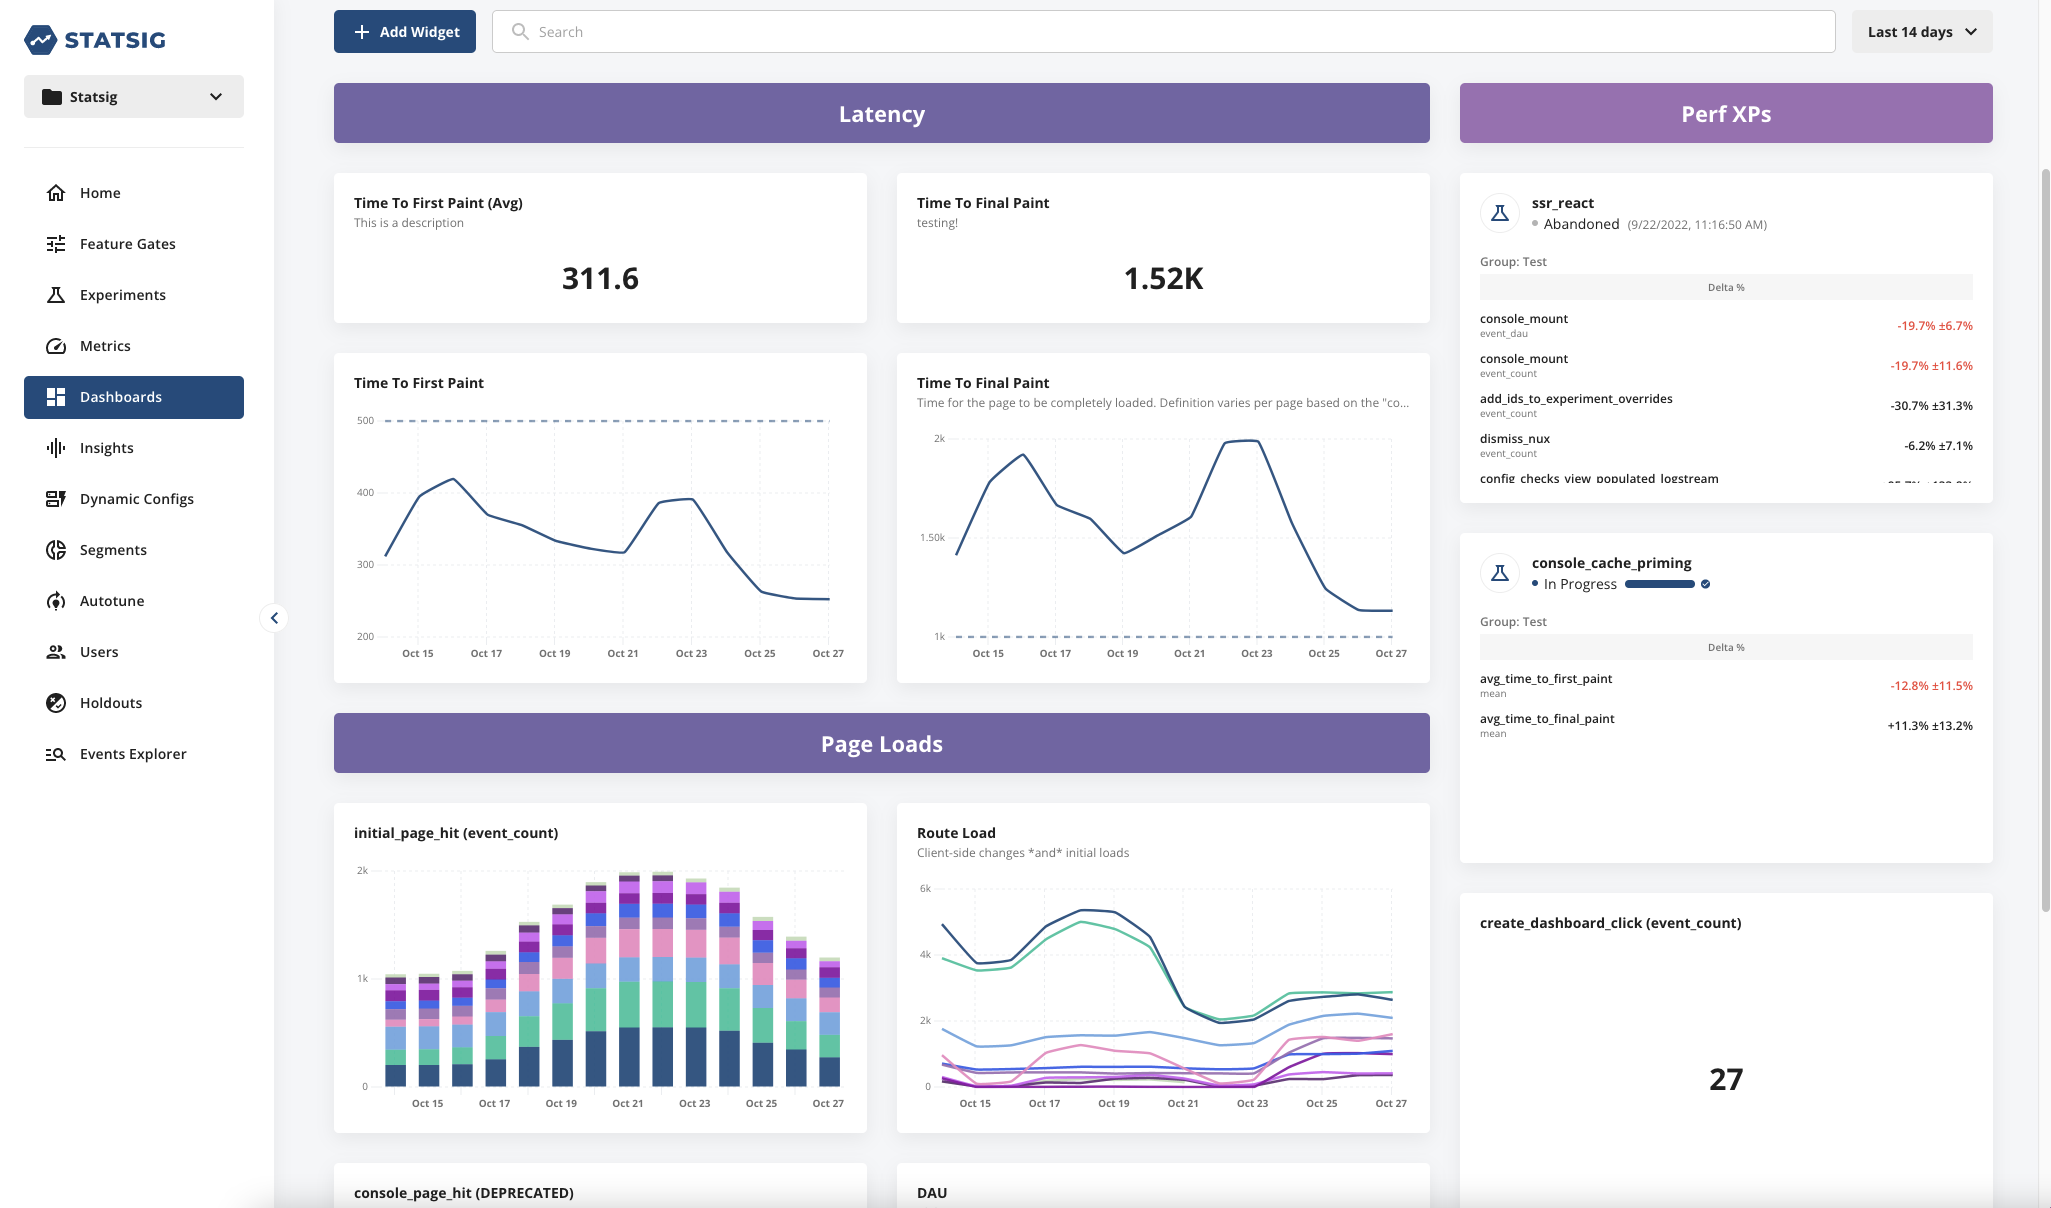
With Dashboards, you can-
Create Custom Time Series - Create line or bar charts of your metrics, including dimension breakdowns for events.
Add Experiment and Rollout Monitoring - Add any Experiments or feature roll-outs that may impact your metrics inline on your Dashboard.
Organize and Label Widgets - Quickly and easily organize your widgets on the drag-and-drop canvas of the Dashboard. Add labels to clearly delineate grouped metrics, as well as caption individual charts to clarify metric definitions.
This is an early v1 foundation for our newest product offering, and something that will continue to evolve. If you have any feedback, we would love to hear it! Don’t hesitate to reach out with feature requests or suggestions for improvements.
Discussion Tags
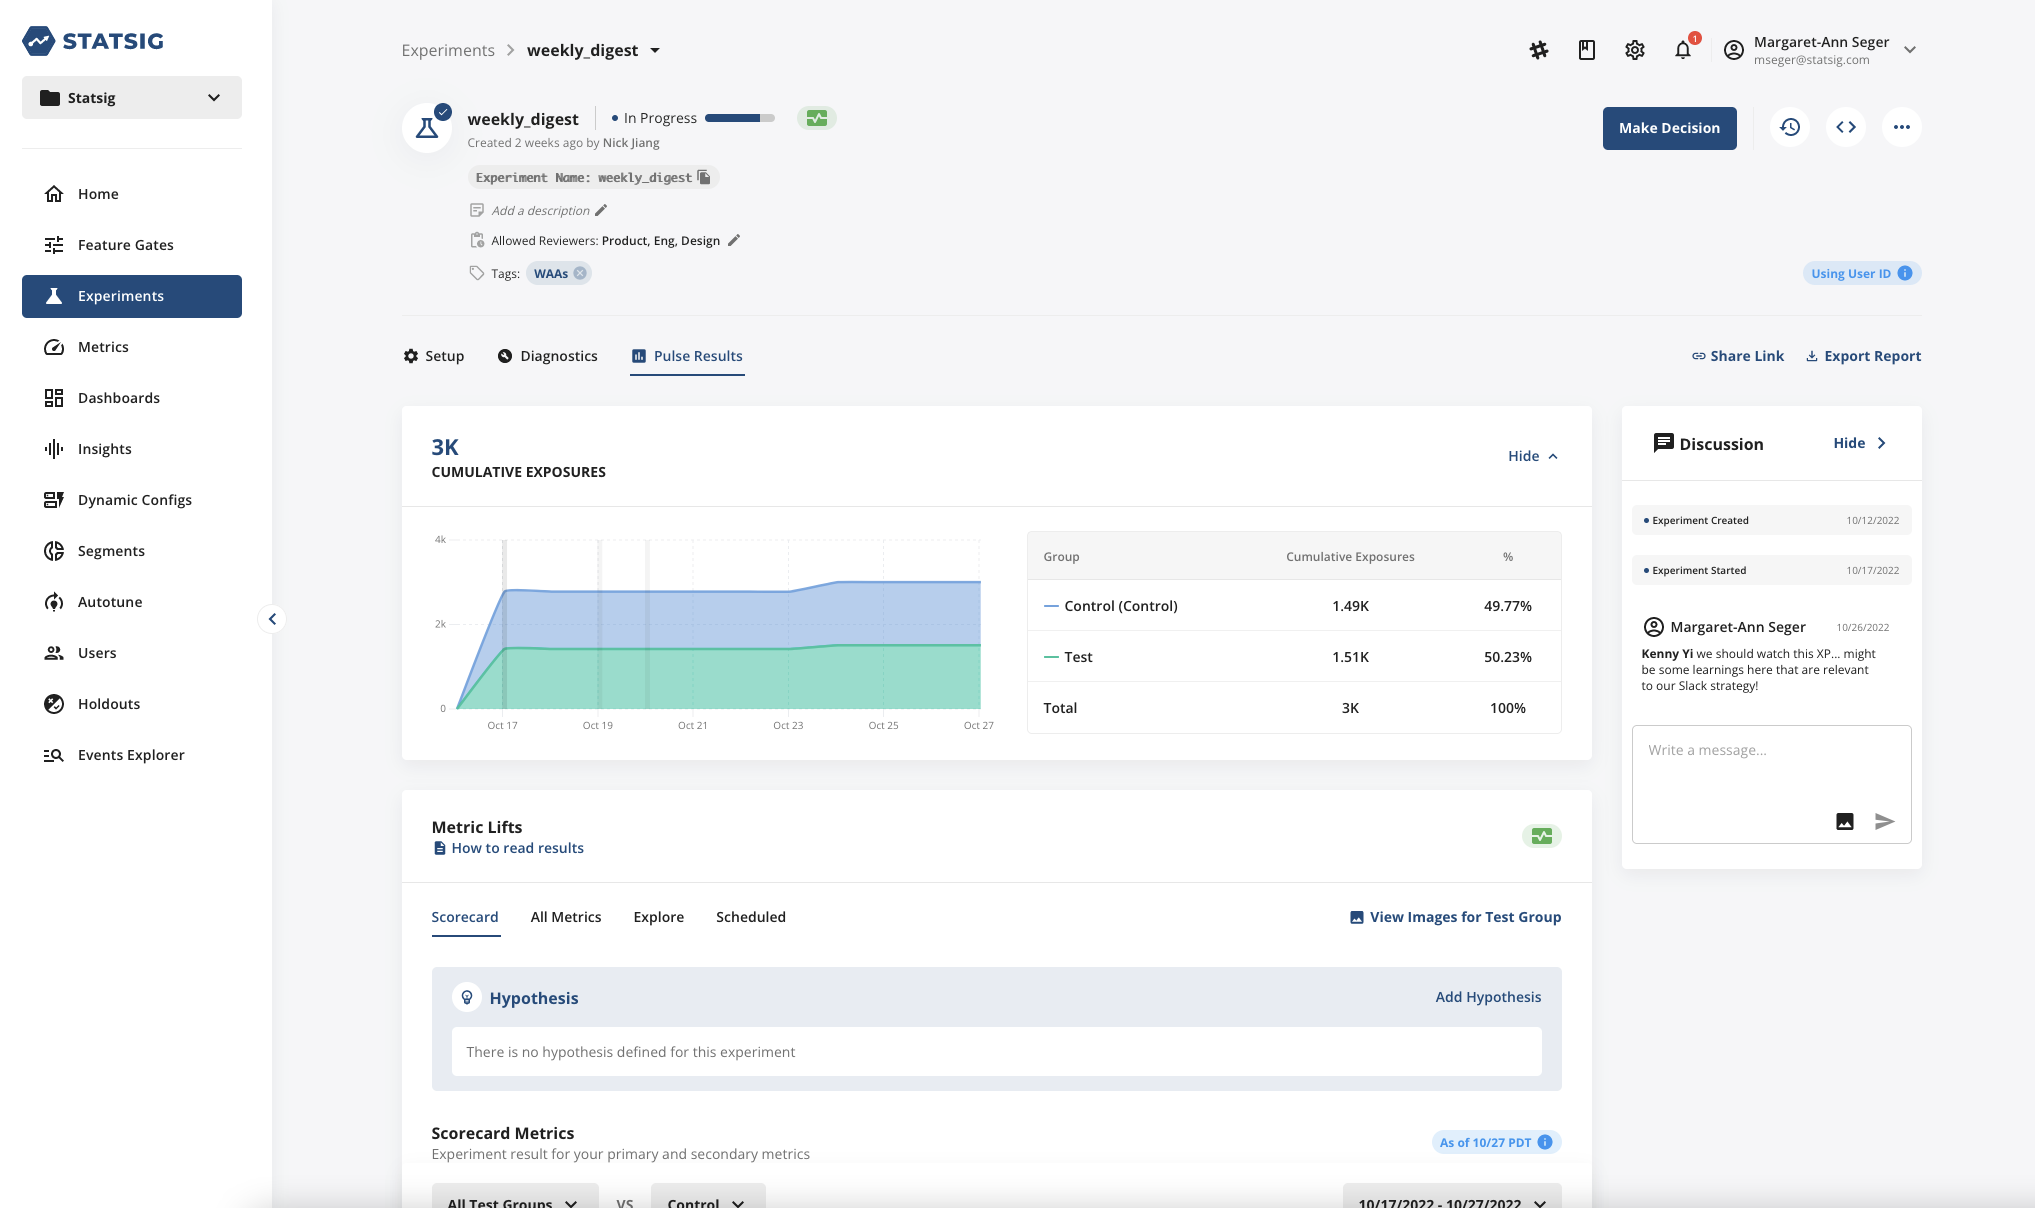
To make adding relevant folks into the conversation on your Experiments and Gates easier, we’ve added the ability to tag team members in Discussions. Tagging team members in a Discussion comment will notify them via email (and soon Slack as well!)
Advanced Search Capabilities
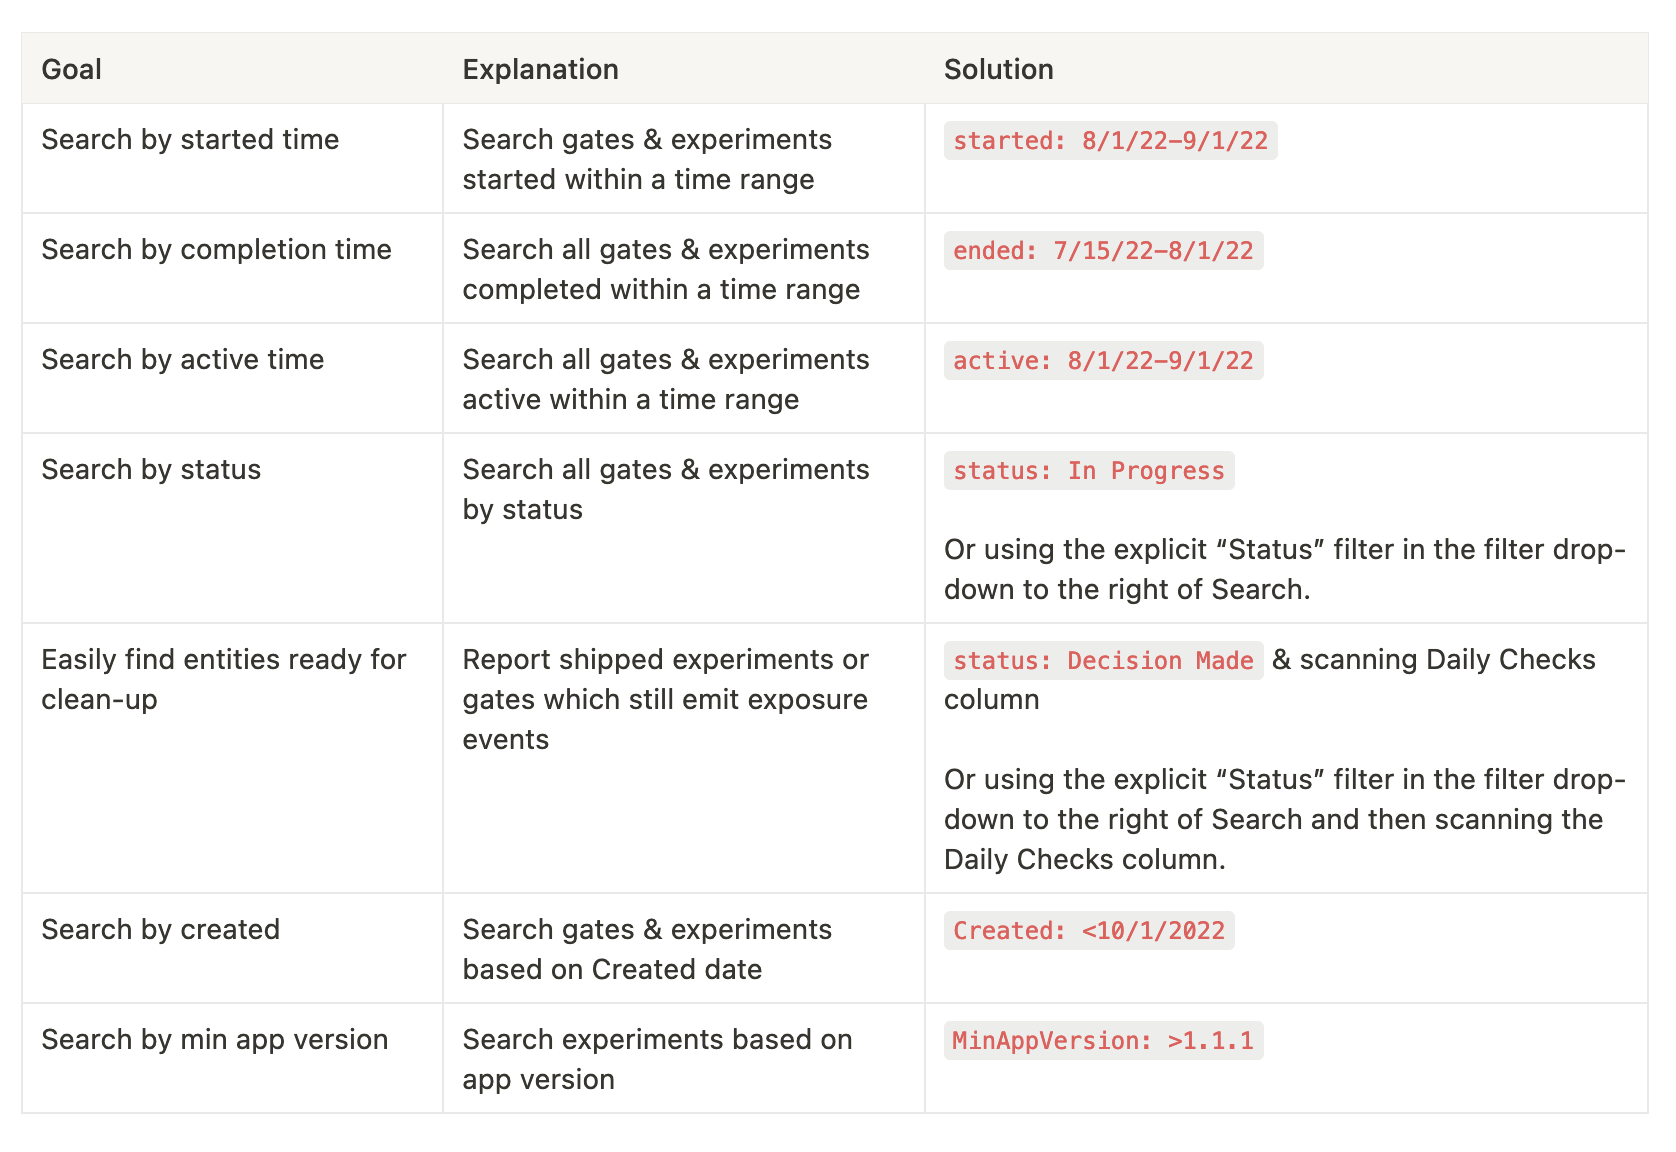
Powerful search capabilities are key to being able to quickly navigate the Statsig Console. Today, we’re excited to announce that we’ve added keyword search for “started”, “ended”, and “active” search keywords, with support for either one date or a date range.
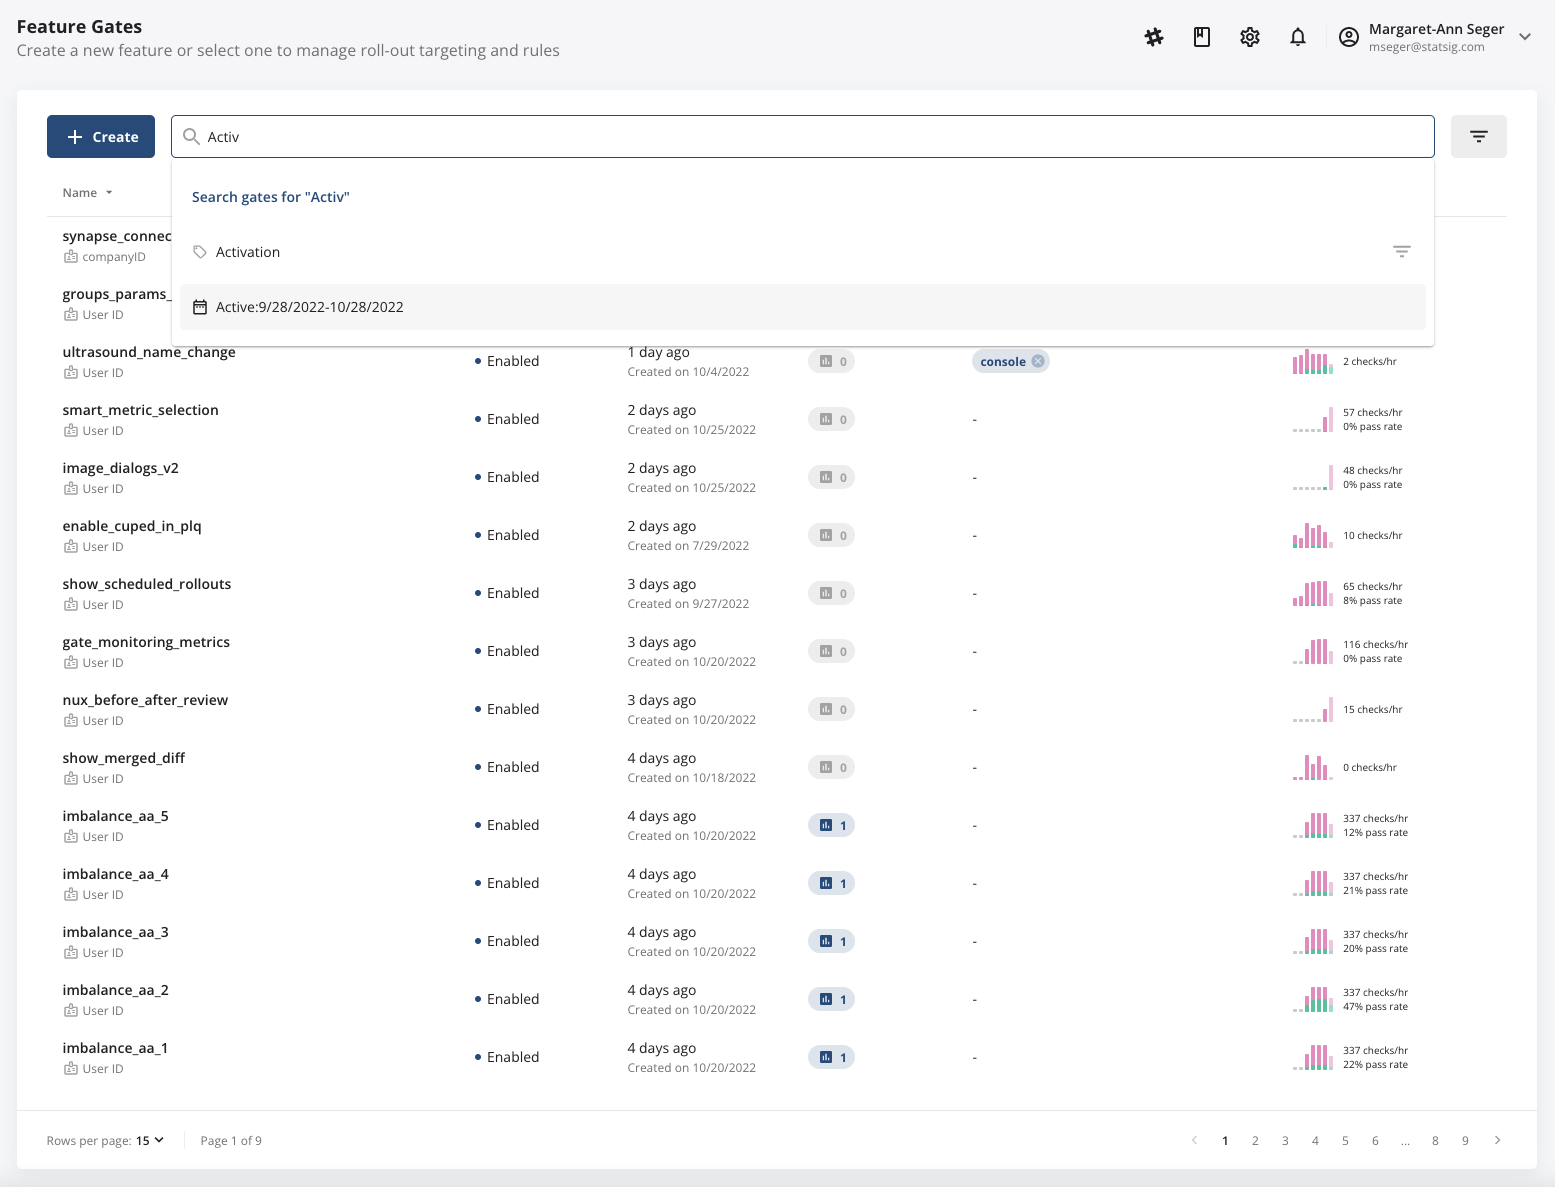
Attached is a table of how to use these. We've also added explicit filter options next to the search bar that will enable you to filter by Status, Health Check Status, ID Type, Creator, & Tag (all of which are also supported directly inline in Search).
Loved by customers at every stage of growth
