Products
Solutions
Resources

Statsig now offers interaction effect detection to uncover the hidden effects of experiments on each other.
To accelerate experimentation, medium to large companies run hundreds of A/B tests simultaneously, aiming to isolate and measure the impact of each change, also known as the "main effect."
However, when multiple tests target the same area of your product, they can influence one another, resulting in either overestimation or underestimation of metric changes.
While a study by Microsoft shows that interaction effects are rare, Statsig wants to provide peace of mind and trust in the results for your experiment journey.
Interaction effect detection is built to maximize the accuracy and efficiency of your experimentation by detecting and managing these interactions, ensuring you confidently make trustworthy decisions.
Scenario: Dark mode gone wrong
Consider these scenarios: two teams at your company are running two experiments concurrently, but they are unaware of what other teams are testing.
Dark mode: This offers a dark appearance to your website, using a dark background and light font. This expands the UI compatibility and aims to improve retention. This has been the most requested feature from your developer audience.
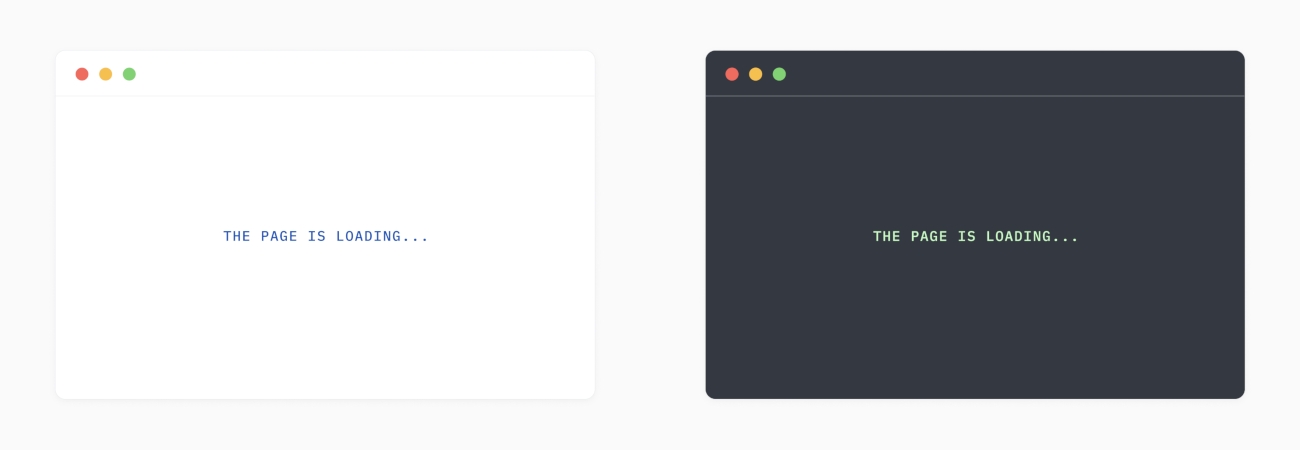
Transition animation: It displays fun illustrations while the page is transitioning. This aims to create a better experience for page loading, reducing the bounce rate. This is part of a comprehensive strategy to build a cohesive and enjoyable product.
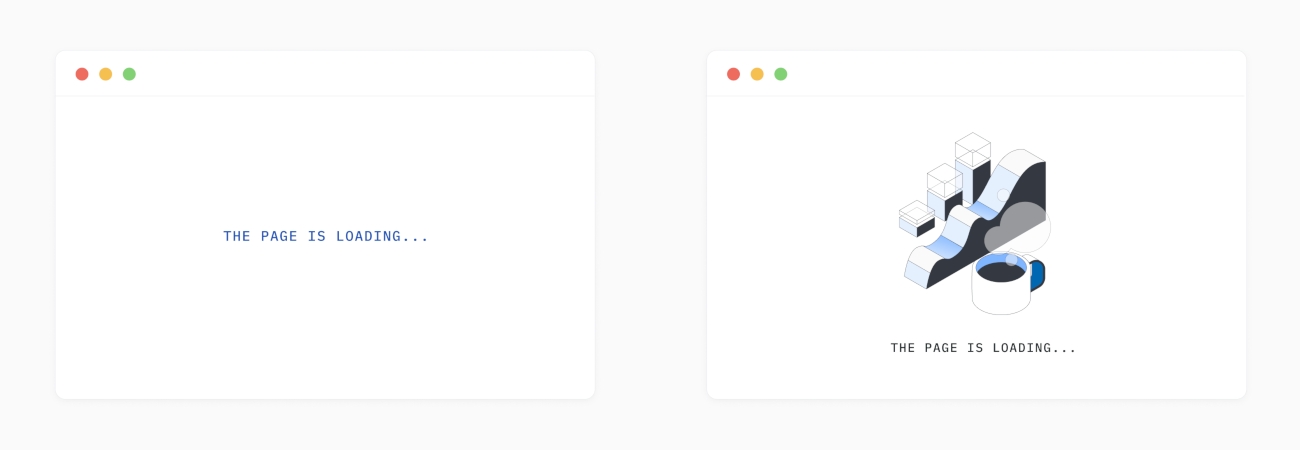


As a best practice, experiments are run on overlapping populations. This means that some users are assigned to both test variants. When combining dark mode and transition animation, it would look like this:

How do we diagnose it?
Statsig uses statistical tests to detect and confirm the presence of interaction effects. For each pair of test variants, we divide the exposed units into 4 groups for reference.
| assignment in dark mode | assignment in transition animation | group name |
|---|---|---|
| light | text | A |
| animation | B | |
| dark | text | C |
| animation | D |
We offer a view of the traffic distribution between the experiments. Here is a screenshot of Statsig UI:

We performed a statistical test to evaluate the difference in lifts and determine if it is significant, ruling out random chance. The difference in lifts from Dark mode between the test and control groups of Transition animation is given by:
\[ \Delta = \left( \bar{X}_D - \bar{X}_C \right) - \left( \bar{X}_B - \bar{X}_A \right) \]
\[ \text{standard error}=\sqrt{\frac{var_A}{n_A}+\frac{var_B}{n_B}+\frac{var_C}{n_C}+\frac{var_D}{n_D}} \]

Since both Revenue and Visits are down when two features are combined, and compared individually, we conclude that there is an antagonistic interaction between dark mode and transition animation.
My experiments are interacting—now what?
To understand the main effect of each experiment, you’d want to look at the pulse in isolation. That is the comparison between group A and B, as well as between group A and C. We provide the group-level statistics for you to calculate interaction-free test results.

From the 4 groups above, you can isolate and understand the results of these two experiments. For example, to understand the effect of dark mode without the transition animation, you would compare group C to group A using a standard two-sample t-test. Likewise, to isolate the impact of the transition animation without dark mode, you would compare group B to group A.
There are several options for next steps:
Relaunch the same experiments to a mutually exclusive audience. This is especially useful if you need more statistical power particularly on secondary metrics.
Conduct manual statistical tests and determine which one of the two features to ship.
If the interaction is synergistic, you can double down on the combined experience, by either launching a new test or analyzing group A and D.
Rework the experience to make the feature compatible.
With our expansive tools, you can rest assured knowing you can achieve both the velocity and trustworthiness of experimentation. The feature is rolling out both on Warehouse Native and Cloud. Please reach out if you are interested. You can learn more about the methodology we used in our documentation on interaction effect detection.
Questions?