Software experimentation has become an increasingly important tool for developers.
Within the last few years, feature flags, experimentation, and analysis have become major accelerators for companies. Naturally, this emerging market has become populated with a dizzying array of vendors. By now, you’ve probably stumbled onto Eppo and may be weighing your options.
What are those options, exactly? Let's take a closer look.
Eppo overview
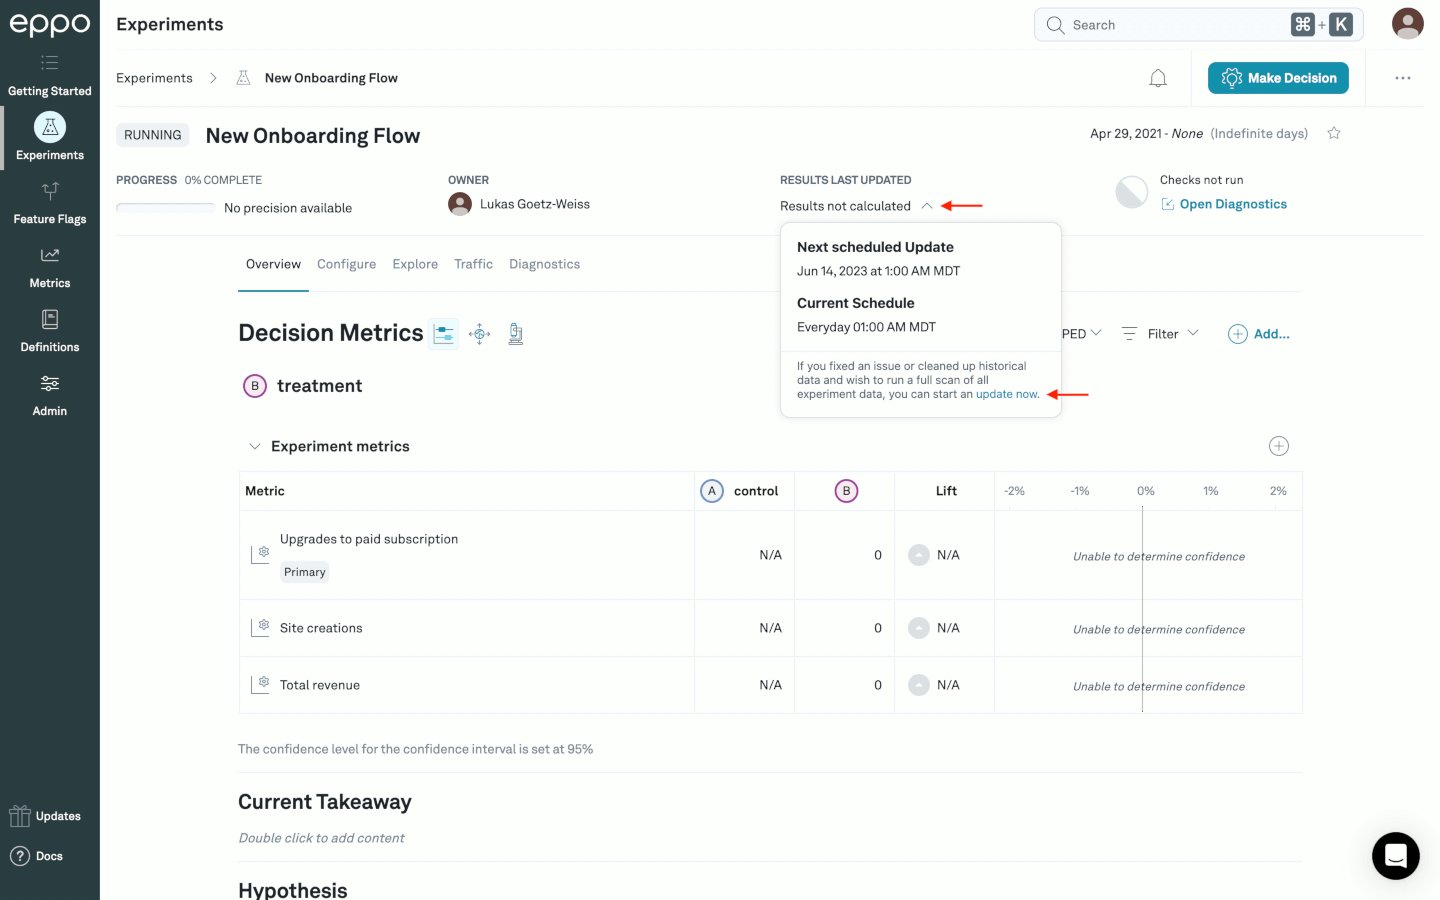
Eppo is a warehouse-native experimentation platform founded in 2021. It is designed to integrate and run experiments directly in your data warehouse, including Snowflake, BigQuery, and Redshift.
Similar to other experimentation platforms, Eppo was founded on the principle that the commercial market lacked the sophisticated experimentation tools provided by large tech companies. In their case, they reference Airbnb—their leadership’s “alma mater” company. Statsig references Meta, Split references Salesforce, and so on.
One of the biggest pain points Eppo addresses is the manual workflow associated with using an out-of-the-box feature flagging platform. “Today’s commercial experimentation offerings are feature flagging tools masquerading as experimentation platforms,” they lament, underlining the importance of vetting experimentation platforms upfront.

Instead of every company individually “reinventing its own wheel,” platforms like Eppo stand to fill that gap so that development resources can be allocated toward what matters.
Pricing model: Eppo does not openly provide a pricing model. To get a quote, you have to talk to a sales representative.
Notable features:
Warehouse Native experimentation
Power Analysis
Metric guardrails
Experimentation
Watch out for: Eppo lacks a robust collaboration suite, making it more difficult to work across teams, relative to other platforms.
Many user reviews mention that Eppo’s updates are daily, rather than real-time, which subtracts from the overall value. They also state that CUPED analysis isn’t available on Eppo explore graphs, leading to inconsistent data.
Another user describes Eppo’s feature set as lacking, as it does not currently offer pre-post experiments and automatic experiment updates upon value flag ramps—despite having similar detection for variation distribution.
Lastly, one user claims that their data warehouse costs are rising, and pinpointing the source of the increase is a challenge.
Despite these snags, Eppo still boasts mostly-favorable reviews, and provides a good solution for companies looking for a warehouse-native experimentation platform.
See also: Statsig’s straightforward, usage-based pricing and free feature flags.
The top 4 Eppo alternatives

1. Statsig
Pricing model: Statsig offers unlimited seats, free feature flags, and easily-predictable prices based on usage.
Starter tier: Up to 500 million free events, and a generous program for startups.
Pro tier: Starting at $150/month
Enterprise and Warehouse-Native: Requires a conversation with sales.
Notable features:
Advanced Stats Engine (CUPED and Sequential Testing with Bayesian or Frequentist approaches)
Highly-rated in-house support team
Holdouts, Experiment Layers, Dynamic Configs, and more
Warehouse-native or cloud-based implementation
Change propagation within seconds
Summary: Founded by ex-Meta engineers, Statsig is the one-stop shop for product experimentation, feature flagging, and analysis. It offers both cloud-based and warehouse-native solutions to fit its users’ dynamic needs.
Despite being less than 3 years old, Statsig boasts hundreds of favorable reviews from customers. Thousands of companies—from startups to Fortune 500s—rely on Statsig
Watch out for: Statsig’s diversity of products can be intimidating. Some users have trouble deciding between Flags, Dynamic Configs, and Layers. One user writes “Statsig does so much; initially trying to wrap my mind around it wasn’t easy.”
Another user states that running multiple sequential experiments on the same parameters requires code changes. This can be overcome by layers, but the mutual exclusivity of experiments within layers makes the process cumbersome.
✅ Feature comparison: Statsig versus Eppo, head-to-head.
Statsig vs Eppo, head to head


2. Amplitude
Pricing model: Amplitude segments its products and charges users incrementally for Analytics, Audiences, Experiments, and CDP. Seemingly-standard features like advanced permissions and real-time monitoring are only available in the highest tier.
Starter tier: A free Amplitude Analytics package with limited functions
Notable features:
Funnel metrics
Clean and clear dashboard UI
An extensive integration catalog
Real-time analytics
Summary: Amplitude is a digital analytics platform that helps teams understand and personalize their products with clickstream monitoring. Amplitude boasts some powerful features, such as real-time analytics, cross-platform tracking, behavioral analysis, and enterprise-level security.
Watch out for: First and foremost, Amplitude does not have a warehouse-native solution.
Amplitude is much more expensive than other tools—but that’s hard to find, as its website beckons users to “contact sales” at every turn. One user states that Amplitude’s growth plan costs $70,000 for 50 million events.
With its high prices and tiers geared towards enterprise businesses, Amplitude is just not suited for startups and smaller teams. User reviews unanimously describe the platform as “overly complex and not user friendly.” One review lays it out bare: “To use Amplitude successfully you need a really good plan and engineers with a very good understanding of the data strategy.”

3. Split
Pricing model: Team tier: $330 per month for 10 seats. Business tier: $600 per month for 10 seats.
Starter tier: Up to 50,000 monthly tracked keys and client and server-side feature flags
Notable features:
Simple to setup and use
Developer-focused product
An extensive integration catalog
Summary: Split is a feature management platform focused on providing users with feature flags and improving the developer experience. In its product description on G2, Split cheekily states that it allows users to move fast “without breaking things.”
Split also offers the ability to conduct experiments like A/B tests without slowing down user workflow.
Watch out for: Split does not have a warehouse-native solution.
While Split is easy to use, it lacks some of the critical features of more advanced experimentation platforms, like global holdouts, mapping features’ effects on KPIs, real-time analytics, and more.
Split also doesn’t support advanced stats features like CUPED, Bonferroni correction, sequential testing, and others.

4. Posthog
Pricing model: Free up to first 1 million events/mo, and then $0.00031/event (usage-based)
Starter tier: Up to 1 million free events/month
Notable features:
Path Analysis
Session replays
Funnel Analysis
Over 50 integrations
Summary: Posthog is an open-source product analytics platform. Posthog's open-source solution enables software teams to capture events, perform analytics, record user sessions, conduct experiments, and deploy new features all in one platform.
One of the benefits of Posthog is that it is entirely open source, allowing developers to build directly on top of the existing product. Admirably, Posthog advertises itself as “the most transparent company in the world,” and documents all of its work publicly, sans customer data.
Watch out for: Open-source products are vastly different from cloud-hosted products. As a consumer, you should know which one is right for you based on your scale.
Being open-source, Posthog struggles to run at an enterprise level and warns users that it only scales to around 100k events per month.
Its CTO outlines further technical challenges of implementing open-source experimentation: “Often the issue is something a couple of layers deep and very hard to debug, involving long calls with expensive engineers on both sides. Even something as simple as a full disk would cause their instance to be down for hours or days.”
Additional reading: Cloud-hosted SaaS versus open-source experimentation platforms.
Statsig vs Eppo, head to head


