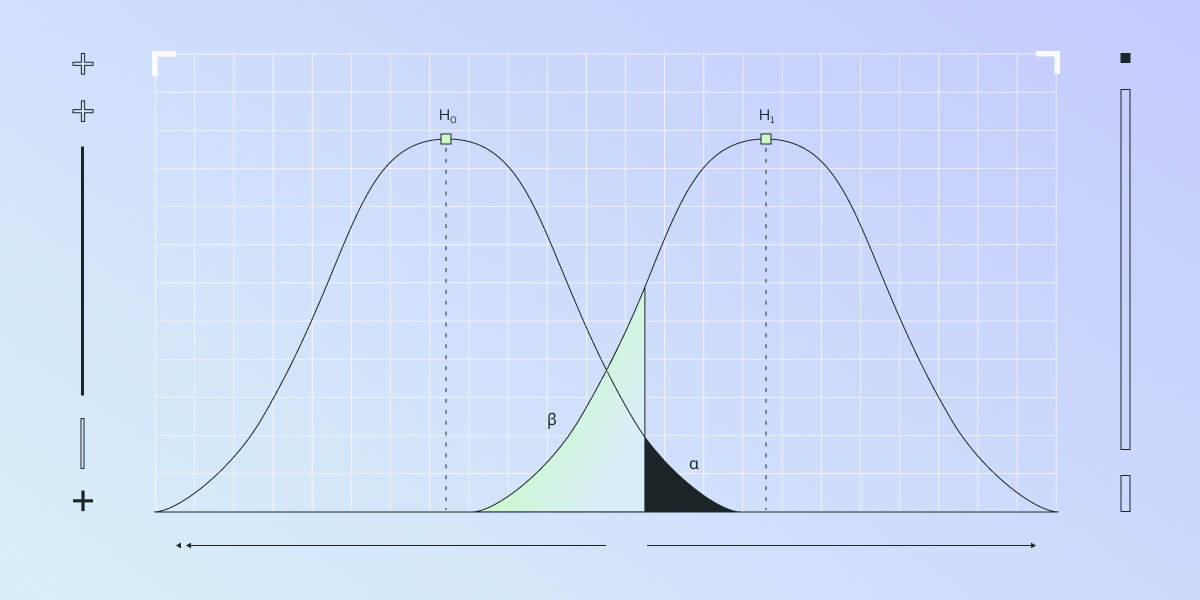
Identify Type 1 and Type 2 errors, optimize sample sizes, and choose the right statistical tests for impactful split testing. Our platform empowers businesses.
In the precision-driven realm of A/B testing, the crux lies in hypothesis testing—a method pivotal for making data-backed decisions. However, the accuracy of these tests hinges on avoiding errors such as Type 1 (false positives) and Type 2 (false negatives).
Type 1 errors, in particular, can mislead by falsely indicating a difference when none exists, leading to costly missteps. This article guides you on effectively reducing Type 1 errors, ensuring more reliable and actionable insights from your split tests.
Utilizing Statsig, we'll demonstrate how to enhance your testing strategies for statistically significant results, ultimately driving more informed and effective decisions.
💡 For a refresher on Type 1 and Type 2 errors, watch Yuzheng Sun explain these concepts to a non-data person in the video above.
Understanding hypothesis testing and types of errors
Hypothesis testing is a statistical method used to evaluate two mutually exclusive theories about a population parameter. In A/B testing, it's a cornerstone for deciding whether a specific change or feature has a significant impact on user behavior or outcomes.
Null hypothesis and alternative hypothesis
The null hypothesis (H0) posits that there is no effect or difference between two testing groups – for instance, that a new feature does not affect user engagement.
The alternative hypothesis (H1) claims the opposite – that there is an effect or difference, such as a new feature improving user engagement.
Statistical significance
Statistical significance is determined by a p-value, which measures the probability of observing the results if the null hypothesis were true. A low p-value (typically less than 0.05) indicates strong evidence against the null hypothesis, suggesting the alternative hypothesis may be true.
Type 1 and Type 2 errors (Type i and Type ii) in A/B testing
A Type 1 error (false positive) occurs when the null hypothesis is incorrectly rejected, suggesting a difference where there is none. In A/B testing, this might mean drawing an incorrect conclusion that a new feature is effective when it isn't.
A Type 2 error (false negative) happens when the null hypothesis is not rejected despite there being a true effect. This error leads to missing out on genuine improvements, such as not recognizing the positive impact of a new feature.
Understanding these errors and their implications is crucial in A/B testing to make accurate and reliable decisions based on data.
Optimizing sample size and statistical power
Importance of sample size in Reducing Type 1 errors
The sample size in an A/B test is critical as it directly impacts the test's statistical power — the likelihood of correctly detecting a true effect. A larger sample size increases this power, reducing the risk of Type 1 errors (false positives).
Large samples provide a more accurate representation of the population, leading to more reliable results. With more data, the influence of random variations is minimized, making it easier to discern true effects from noise.
How Statsig facilitates optimal sample size determination
Statsig offers tools to calculate the optimal sample size for your tests, considering the desired power and the minimum detectable effect. This helps in planning tests that are neither underpowered (risking Type 2 errors) nor unnecessarily large (wasting resources).
Statistical significance calculator

The role of p-value and significance level
The p-value is the probability of observing results as extreme as those in your test, assuming the null hypothesis is true. A low p-value indicates that such extreme results are unlikely under the null hypothesis, suggesting a significant effect.
The significance level, often set at 0.05, is the threshold for determining statistical significance. It’s the probability of rejecting the null hypothesis when it is actually true, hence committing a Type 1 error.
Balancing significance level and error risks
There's a trade-off between the significance level and the risks of Type 1 and Type 2 errors. Lowering the significance level reduces the chance of Type 1 errors but increases the likelihood of Type 2 errors (failing to detect a true effect).
Choosing the right significance level involves balancing the cost of false positives against the risk of missing true positives. In A/B testing, this decision should align with the test's objectives and the potential impact of both types of errors.
Statistical tests and effect size
Variety of statistical tests in A/B testing
In A/B testing, various statistical tests are used to determine the significance of results. The t-test, for instance, is commonly employed to compare the means of two groups (e.g., control and treatment in an A/B test) and understand if the differences observed are statistically significant.
Other tests include chi-square tests for categorical data and ANOVA for comparing more than two groups, each suited for different types of data and hypotheses.
Understanding and interpreting effect size
Effect size is a quantitative measure of the magnitude of the experimental effect. It's crucial for understanding the practical significance of test results.
While statistical significance indicates whether an effect exists, effect size tells us how large that effect is. In real-world terms, a statistically significant result with a small effect size might not be practically meaningful. Therefore, understanding effect size is essential for interpreting the impact and value of A/B test results in practical scenarios.
Sequential testing
Sequential testing involves periodically analyzing data as it's collected during an A/B test, rather than setting a fixed sample size upfront. This approach allows for early termination of the test once sufficient evidence is gathered, either for or against the null hypothesis.
By continuously monitoring the data, sequential testing reduces the likelihood of Type 1 errors as decisions are made based on accumulating evidence, minimizing the chance of false positives due to random fluctuations early in the test.
Bayesian statistics
Bayesian statistics offer a different approach by incorporating prior knowledge or beliefs into the analysis. This prior information is updated with new data from the A/B test to form a more comprehensive view of the results.
Bayesian methods can be particularly useful in reducing Type 1 errors, as they provide a way to weigh the test results against existing evidence or assumptions. This can help prevent overinterpretation of spurious results, leading to more reliable conclusions.
Practical tips and best practices
Effective validation techniques
Rigorous validation is key to trustworthy A/B testing. Use techniques like cross-validation to ensure that your test results are not specific to a particular sample or period.
Consistently check for data quality issues like missing values or outliers, as these can skew your results.
Confidence intervals and data interpretation
Use confidence intervals alongside p-values to understand the range of effect sizes that are plausible given your data. This provides a more nuanced view than a simple 'significant/non-significant' result.
Remember that statistical significance does not imply practical significance. Assess the effect size and confidence interval to determine if the change is meaningful in a real-world context.
Balancing significance levels
Be aware of the trade-offs when choosing a significance level. A lower level reduces the risk of Type 1 errors but increases the chance of Type 2 errors. Consider the context of your test and what error type is more critical to avoid.
In some cases, especially where safety or high costs are involved, opting for a more stringent significance level (like 0.01) might be appropriate.
Leveraging tools and technology
The role of python in statistical testing
Python, with its extensive libraries like SciPy and Pandas, is a powerful tool for conducting statistical hypothesis testing. It allows for complex data manipulation, statistical analysis, and interpretation.
Python's capabilities in handling large data sets make it ideal for robust A/B testing, where the precision of calculations is paramount.
Statsig for streamlined A/B testing
Statsig provides an integrated platform that simplifies the process of setting up, running, and analyzing A/B tests. It helps in efficiently managing user segmentation, test variation deployment, and result tracking.
With Statsig, you can visualize data trends, calculate standard deviations, and interpret results for statistically significant insights. The platform's user-friendly interface makes it accessible for both technical and non-technical users, ensuring that data-driven decision-making is a cornerstone of your strategy.
Data visualization and standard deviation analysis
Effective data visualization is crucial for interpreting A/B test results. Tools like Python’s Matplotlib and Seaborn can transform complex data sets into understandable graphics, aiding in clearer decision-making.
Standard deviation analysis is fundamental in assessing the variability in your data. Understanding this variability is key to interpreting the reliability of your test results, and Python excels in performing these computations accurately and efficiently.
Incorporating these practical tips and leveraging advanced tools and technologies like Python and Statsig can significantly enhance the effectiveness and reliability of your A/B testing efforts.
Create a free account

The takeaway: actionable steps to reduce Type 1 errors in A/B testing
Increase sample size
Explanation: Larger sample sizes reduce variability and increase the reliability of the test results.
Adjust the significance level
Explanation: Setting a lower significance level (p-value) reduces the likelihood of false positives.
Implement sequential testing
Explanation: Sequential testing allows for continuous assessment, reducing premature conclusions.
Employ Bayesian statistics
Explanation: Bayesian methods incorporate prior knowledge, which can help balance the evidence from the data.
Apply the Bonferroni correction
Explanation: This correction is crucial when conducting multiple comparisons to prevent the inflation of Type 1 error rates.
Pre-register hypotheses
Explanation: Defining hypotheses and success criteria beforehand prevents data dredging and p-hacking.
Focus on practical significance
Explanation: Considering the effect size and practical impact helps to distinguish meaningful differences from statistical noise.
Replicate the findings
Explanation: Replication validates the findings and ensures consistency across different samples or experiments.
Request a demo

Featured
Build fast?
Recent Posts
One-tailed vs. two-tailed tests
Understand the difference between one-tailed and two-tailed tests. This guide will help you choose between using a one-tailed or two-tailed hypothesis! Read More ⇾
When allocation point and exposure point differ
This guide explains why the allocation point may differ from the exposure point, how it happens, and what you to do about it. Read More ⇾
Move fast, ship smart: The engineering practices behind Statsig’s growth
From continuous integration and deployment to a scrappy, results-driven mindset, learn how we prioritize speed and precision to deliver results quickly and safely Read More ⇾
Announcing the Statsig <> Azure AI Integration
The Statsig <> Azure AI Integration is a powerful solution for configuring, measuring, and optimizing AI applications. Read More ⇾
Building an experimentation platform: Assignment
Take an inside look at how we built Statsig, and why we handle assignment the way we do. Read More ⇾
Decoding metrics and experimentation with Ron Kohavi
Learn the takeaways from Ron Kohavi's presentation at Significance Summit wherein he discussed the challenges of experimentation and how to overcome them. Read More ⇾


