✍️ This guest post was contributed by Peak Velocity reader Issy Butson.
Picture this: you’re busy analyzing how a new feature affects your app’s user engagement, but it seems like the feature doesn't make a dent.
But what if you're missing something? What if there's a significant impact, but it's just not showing up in your initial analysis?
Welcome to the world of type II errors in data analysis, where important effects sometimes hide right under our noses. This article is all about uncovering these hidden gems. We'll explore how eype II Errors can lead us astray and share some handy tips to spot and minimize them, ensuring your data insights are both accurate and actionable.
The basics of type 2 errors
Type 2 errors are like hidden obstacles in the world of data analysis. They happen when you conclude there's no effect from your experiment or strategy, but you're actually missing a crucial impact. Think of an e-commerce company analyzing the impact of a new checkout design. They conclude it doesn't boost sales conversions, yet—unbeknownst to them—it has actually substantially enhanced customer satisfaction and lowered return rates. This is a classic type 2 error in action.
It's different from a type 1 error, where you mistakenly see an effect that isn't there, like thinking a new website feature is driving traffic when it's unrelated. Understanding the distinction between these errors is vital. It ensures we interpret our data accurately, helping us make decisions that are truly informed by what's actually happening, not by what we mistakenly think is happening. This understanding is crucial for leveraging data effectively and avoiding costly missteps based on incorrect or incomplete data interpretations.
The bank robber example

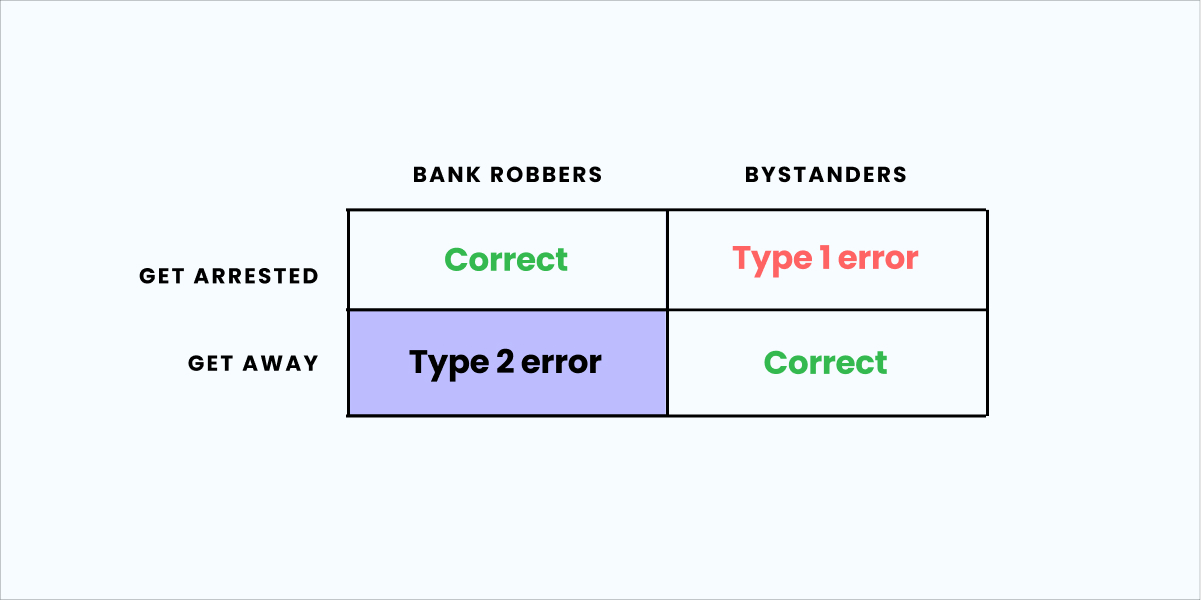
In the video “Explaining type 2 errors to my non-data friend,” Yuzheng Sun and Jack Virag use the example of bank robbers to illustrate the difference between type 1 and type 2 errors.
Imagine a large group of people on trial for a bank robbery, but only a handful of them are guilty. The judge wants all bank robbers to go to jail, and all the innocent bystanders to walk free.
There are two ways this can go wrong:
Type 1 error: Bank robbers get away scot-free
Type 2 error: Innocent bystanders are falsely convicted of bank robbery
Check out the video for a deeper explanation, as well as insight into precision, recall, and what they mean in data science scenarios like this one.
The role of null hypothesis in understanding errors
The null hypothesis is a fundamental aspect of statistical testing, representing the initial assumption that a new intervention or change has no significant effect. Going back to our e-commerce example, the null hypothesis would assert that the new release has no effect on sales.
When this hypothesis is inaccurately maintained due to insufficient or inadequate testing, our classic type 2 error trips us up. Errors like this can lead to missed opportunities, such as disregarding a marketing approach that could have positively influenced sales, or—in our example—a checkout experience that had other positive outcomes.
Testing the null hypothesis rigorously is not just a statistical exercise; it involves an in-depth exploration of various factors. This includes examining the broader context of the test, ensuring the integrity and diversity of the data set, and utilizing appropriate and robust analytical methodologies. It's a process that requires a careful balance between skepticism and openness to new insights.
In cases where the null hypothesis is rejected, it can reveal new understandings and opportunities. For example, in product development, correctly identifying the positive impact of a new feature can lead to strategic enhancements that significantly boost user experience and engagement. On the other hand, failing to detect such an impact can lead to underutilizing a potentially game-changing feature.
The role of the null hypothesis in statistical testing, then, is pivotal. It underpins the process of discovering genuine effects and differences, guiding businesses and researchers in making decisions that are not just based on data but also on a comprehensive understanding of the data's context and quality. This approach is crucial in avoiding type 2 errors, which—as we’ve seen—can lead to missed opportunities for innovation and improvement.
Practical implications of type 2 errors
Type 2 errors can profoundly impact anyone heavily reliant on data-driven strategies.
Consider a scenario where a newly implemented feature is analyzed for its impact on user productivity. The initial data suggests no significant effect, leading to the feature being overlooked. Behind the scenes, a type 2 error has occurred—the feature significantly boosted efficiency, which wasn’t picked up, meaning users are missing out on potential productivity gains.
In feature flagging and A/B testing, type 2 errors can subtly mislead. For example, a new variant might slightly but meaningfully increase user engagement. However, if this improvement falls within the margin of error or is obscured by other data variations, it could be mistakenly overlooked as insignificant, leading to a missed opportunity for connection.
Bouncing back into e-commerce, type 2 errors are hurting us again. Imagine a situation where a new algorithm, designed to optimize stock levels, is analyzed. The analysis overlooks subtle but key indicators of its effectiveness due to data noise or inadequate testing methods, and is wrongly dismissed. This leads to missing its real benefits in streamlining inventory, affecting operational efficiency and the overall shopping experience.
These examples demonstrate that beyond data collection, the critical interpretation of data is key. It’s about diving deeper, challenging initial conclusions, and ensuring that decision-making is informed by accurate, comprehensive data insights. This approach not only minimizes type 2 errors but also unlocks the true potential of data-driven strategies.
Read our customer stories

Balancing type 1 and type 2 errors
Context is key. In product optimization, for example, where making unnecessary changes can be costly, reducing type 1 errors is crucial. And in dynamic markets where failing to capitalize on emerging trends can be detrimental, focusing on keeping type 2 errors to a minimum becomes essential.
Balancing type 1 and type 2 errors isn't just about statistical know-how. It's about seeing the bigger picture: how data impacts real business decisions. And good data analysis isn't only about crunching numbers; it's about understanding what those numbers mean for your business goals and adapting your strategies accordingly.
Tips for minimizing type 2 errors
To make the most accurate and informed decisions from your data, minimizing type 2 errors is crucial. Here are some tips to help you prevent the most common traps:
Thorough data sampling: Ensure your data sample is large and varied enough to truly represent the scenario you’re analyzing. This helps avoid missing real effects due to a narrow or unrepresentative sample.
Robust testing methodologies: Use sensitive testing methods to catch those subtle yet crucial effects. This could mean leveraging advanced statistical techniques or employing iterative testing to build a more complete picture.
Leveraging advanced analytics tools: Modern tools equipped with AI and machine learning can identify patterns and effects that traditional methods might overlook.
Incorporating these practices into your data analysis process can significantly reduce the risk of type 2 errors, leading to more reliable, effective decision-making based on a deeper understanding of your data.
Conclusion
Understanding type 2 errors isn't just a technical necessity; it's a crucial skill in our data-centric era. It's about ensuring we fully harness the power of data to not miss those insights that could be game-changers. In a world where decisions increasingly hinge on data, the precision of our analysis has become non-negotiable. By mastering how to identify and minimize type 2 error, we're not just crunching numbers—we're paving the way for smarter strategies and breakthrough innovations.
Above all, this is about transforming data from mere numbers into meaningful narratives that drive impactful decisions. If you’re ready to put your data to work in ways you never thought possible, Statsig can help.
For a no-obligation demo that’s fully tailored to your organization, just drop us a line.
Request a demo


