Event-Based Cohorts in Metrics Explorer
Advanced Product Analytics with Event-Based Cohorts in Metrics Explorer
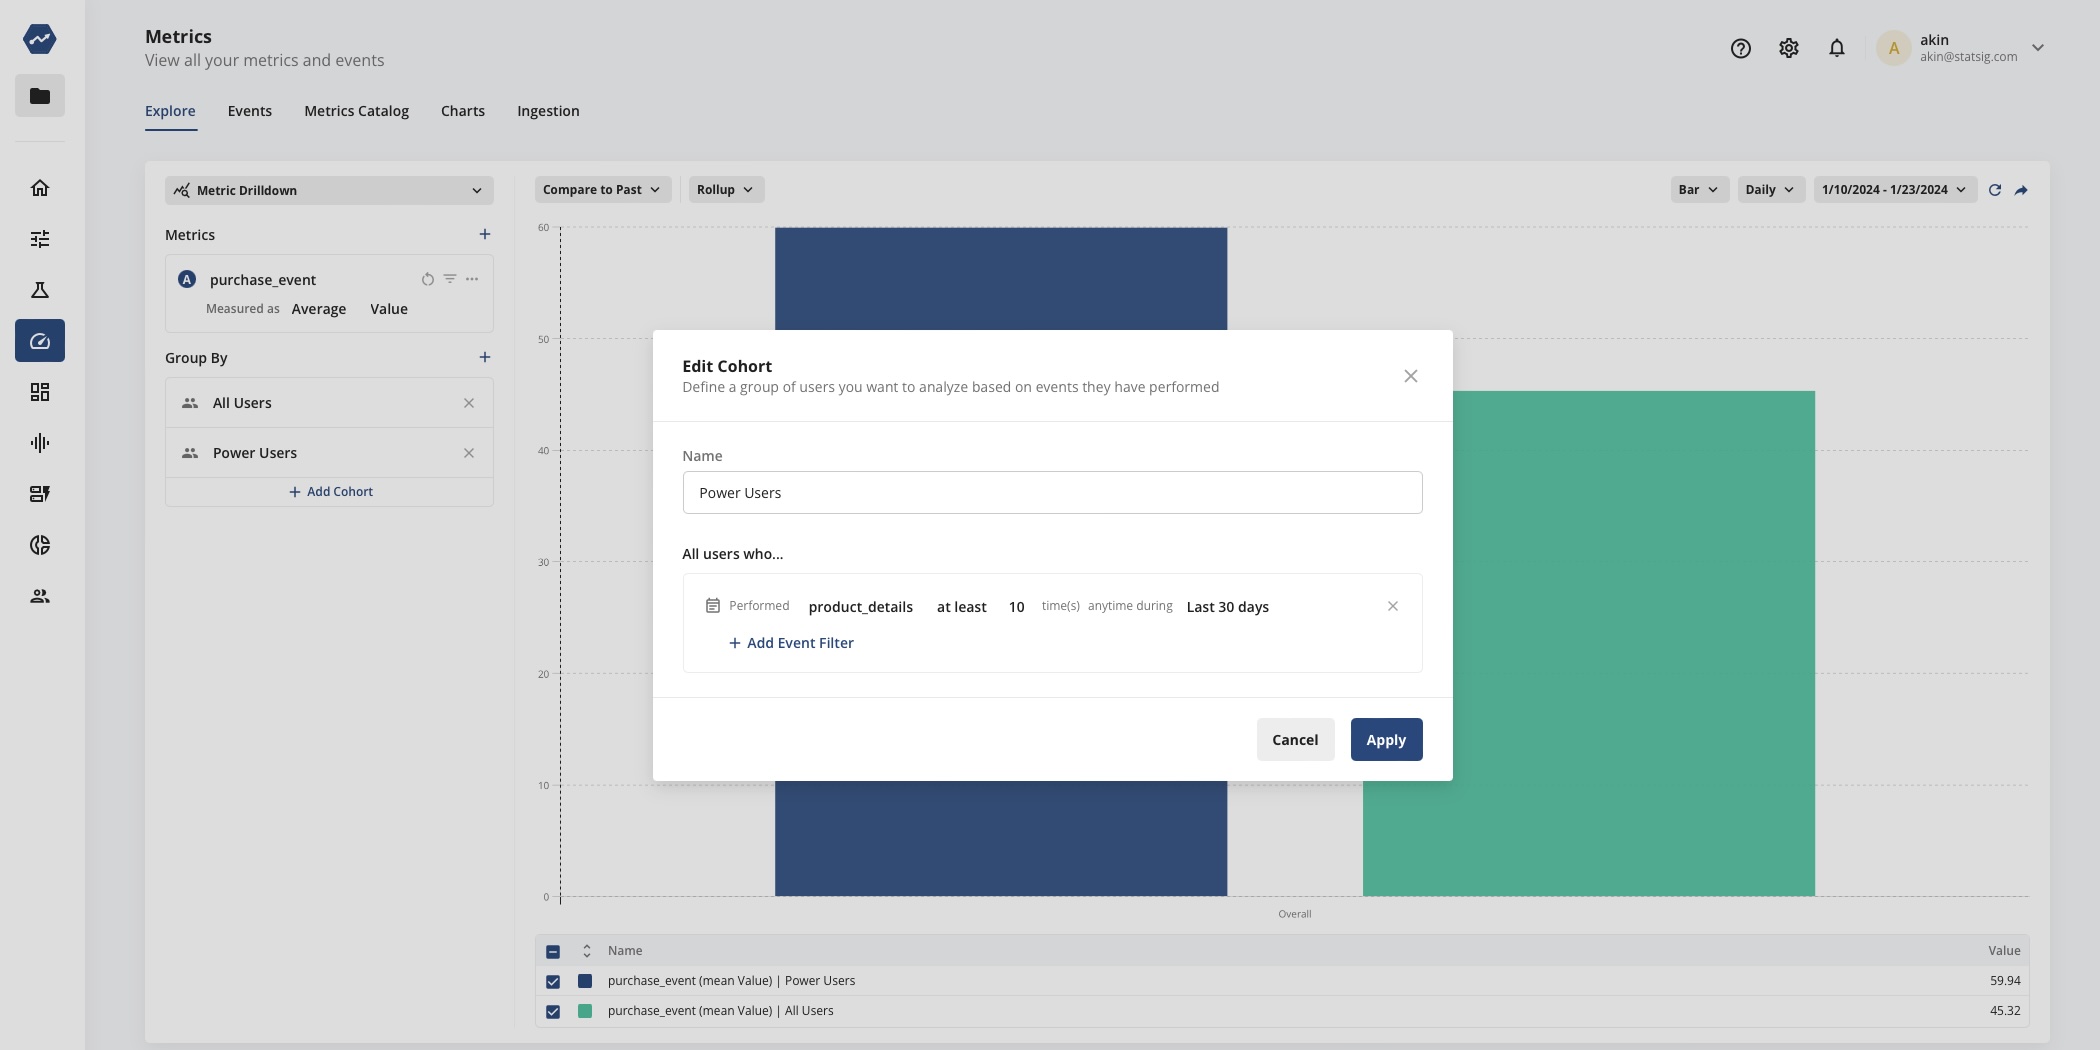
You can now perform detailed analysis on almost arbitrarily specific user segments with our new Event-Based Cohorts feature in Metrics Explorer. Event based cohorts allow you to group users who performed certain events and share specific properties. You can specify the minimum, maximum, or exact number of times users in the cohort performed the given event, and specify the date range within which they performed it. You can also add multiple property filters to the cohort. This is useful in many scenarios:
Create multiple cohorts of interesting user segments and compare their product usage. You can add multiple cohorts to your group-by, and use it was a way to compare different segments of users. For example, you can use the Distributions chart to find the usage that represents the 90th percentile for some event/feature of interest, and then create a “power user” cohort in a Drilldown chart by setting the event frequency to that 90th percentile. You can then create an “all users” cohort and compare the two.
Filtering by a Cohort. Define an event based cohort and use it as a way to filter your analysis. For example dig into low engagement users by filtering you cohort who used a feature at most 1 time in the last month.
Get started with this new feature by going to Metrics Explorer (click on the Metrics tab in the left navigation menu), mousing over to the Group-By section and clicking “+” button and selecting “Compare Cohorts” to begin defining your cohort.

Loved by customers at every stage of growth


