Slice by Feature Gate group in Metrics Explorer
Analyze Product Metrics by Feature Gate Rule in Metrics Explorer
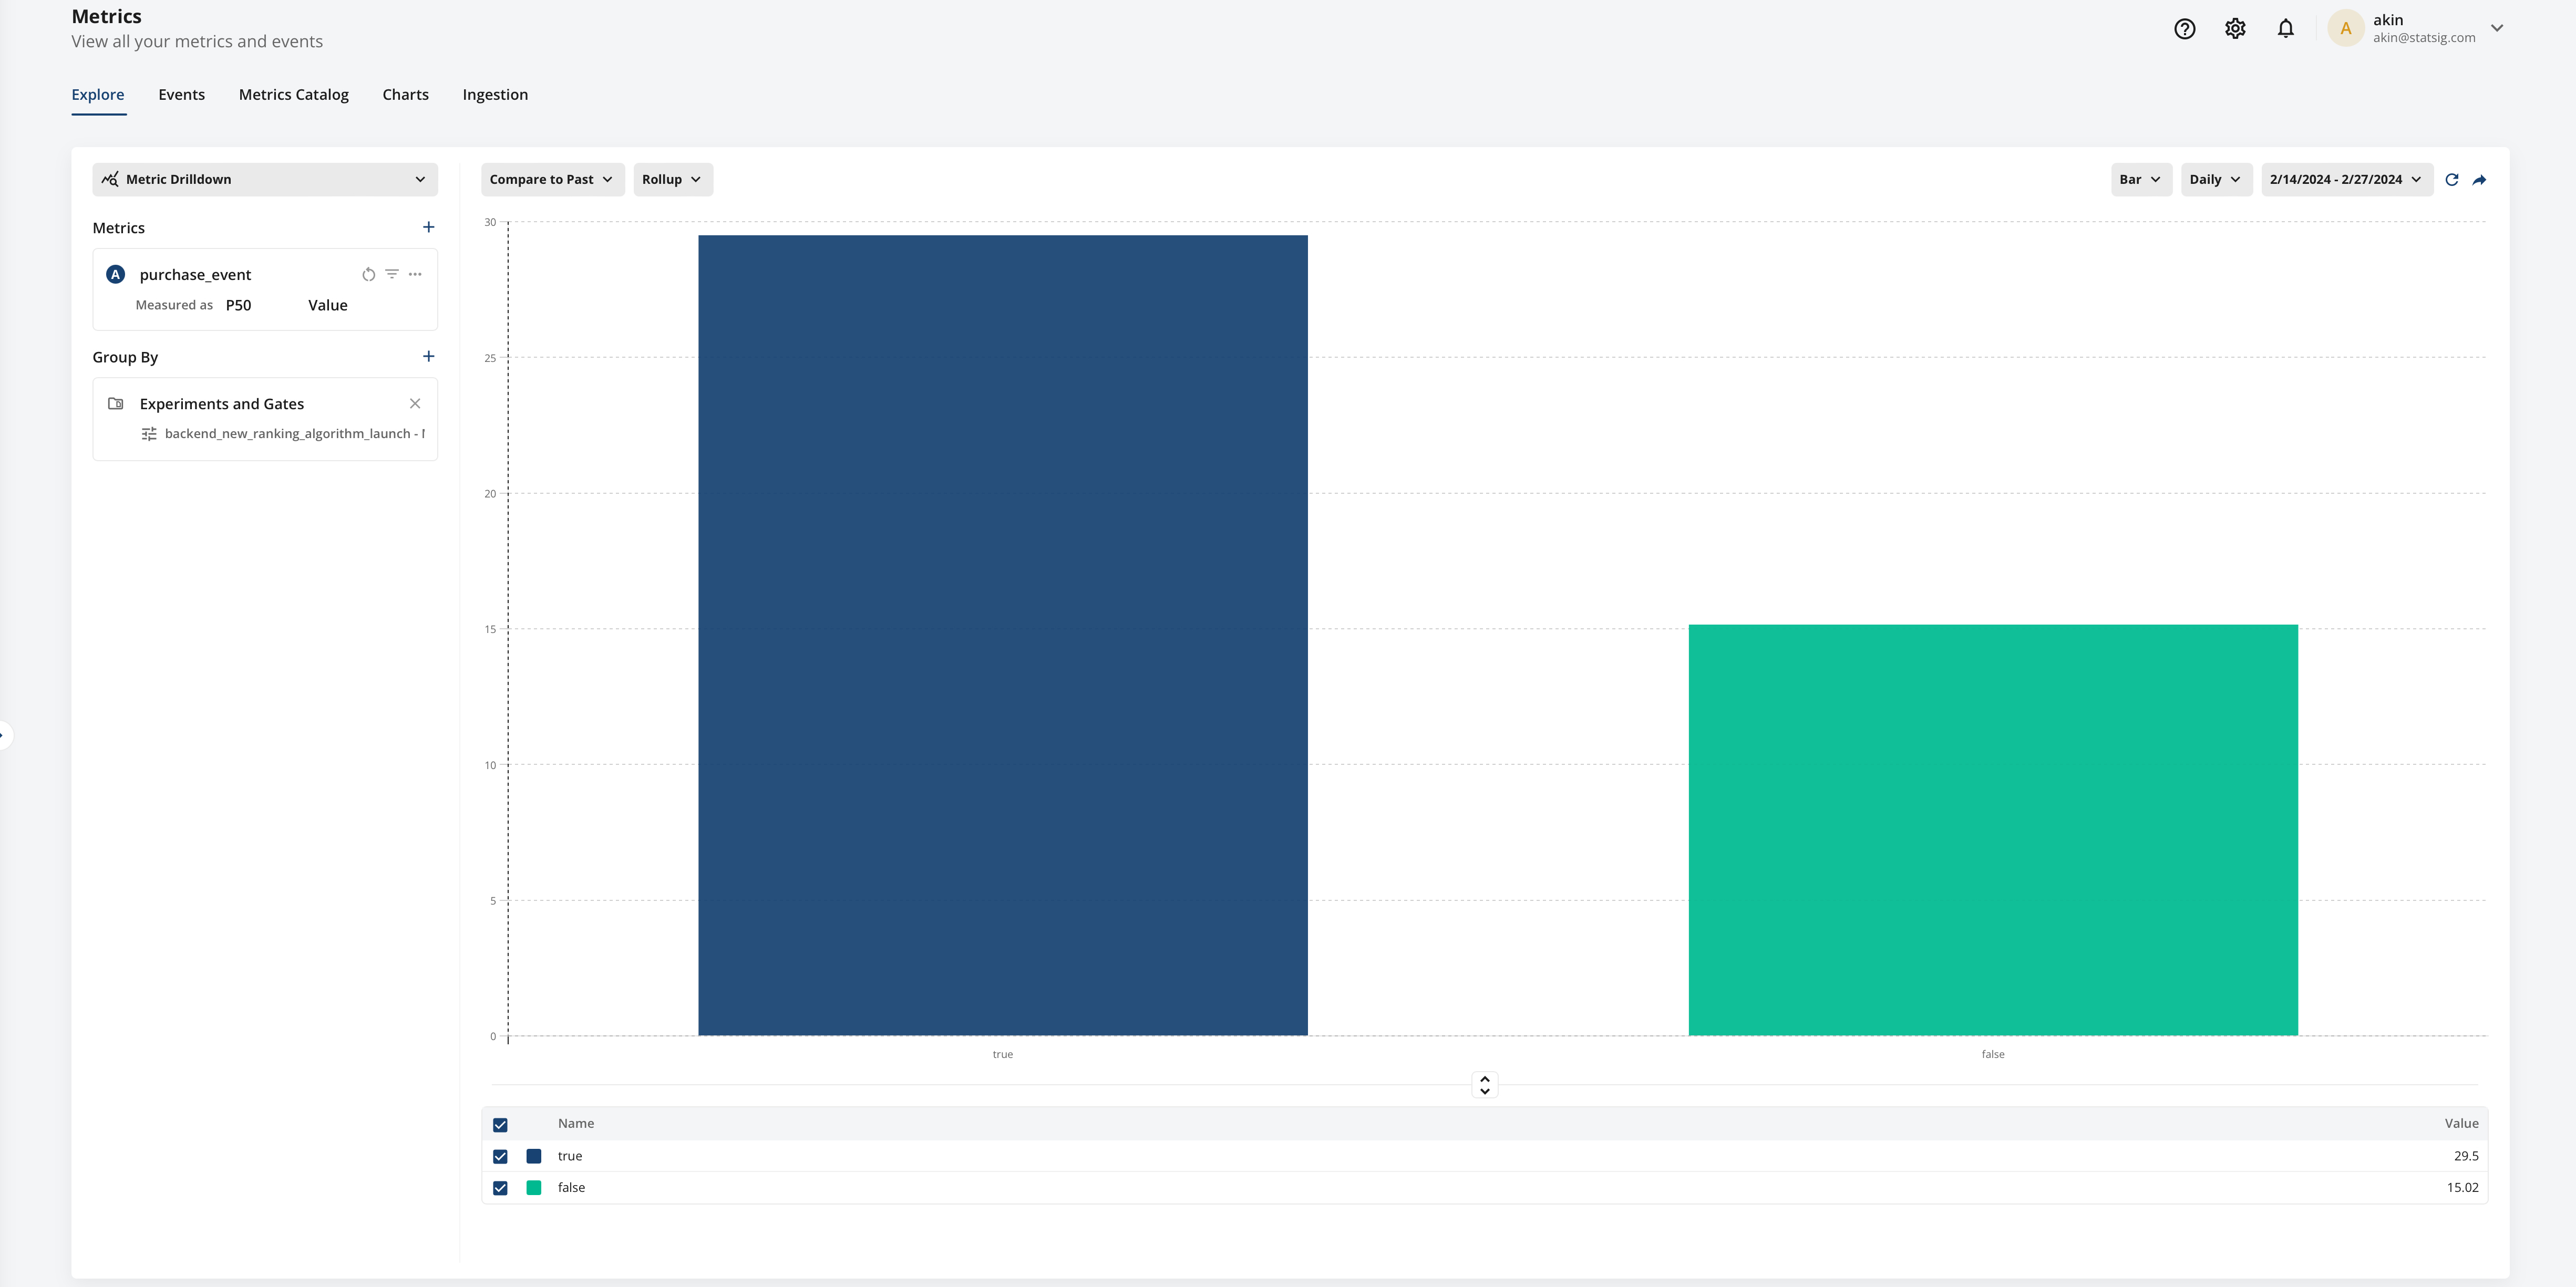
In January, we announced the ability to perform segment analysis based on Experiment Groups. Today, we're expanding that functionality to include Feature Gates as well. Try out this feature today by selecting a metric of interest, choosing a group by, and selecting "Experiments and Gates."
Group-by Feature Gate: Segmentation analysis is one of the most powerful tools product teams have when making targeted improvements to a product. Now, with the ability to group by Feature Gate, you can get a general sense of how a metric is performing for different Feature Gate rules, view the long-term effect of a feature, or monitor and debug the product performance of a feature before rolling it out broadly.
View a Sample of Events that Contribute to a Metric for a Given Feature Gate/Experiment in Metrics Explorer: When performing an analysis on an Experiment or Feature Gate, you can now switch from a Line chart to the "Samples" view, where you can see a sample of raw events. When grouped by an Experiment or Feature Gate, you can see a sample of events that affect your given metric, separated by the Feature Gate rule /Experiment Group the user was in. This is a great way of checking your experiment or feature roll out setup, or to gain a better sense of why specific groups are behaving in the way they are.

Loved by customers at every stage of growth


