Products
Solutions
Resources

And a year of winning together
When I first visited the Statsig office in March, the air was thick with energy and anticipation. Vijaye, Tim, and I spent an hour discussing pricing, margins, and comps. Next month, Vijaye wrote a great blog post speaking to customers about Statsig’s pricing philosophy: we win when you win. The details may have varied, but nothing has held more true for every product and feature that we’ve shipped… and every shot that we’ve taken in 2021.
What struck me the most when I first joined Statsig was how fast we shipped. Putting Amazon’s two-pizza teams to shame, Statsig was running faster than any team I’d ever worked with over my 17 years of professional life. Soon I was asking myself whether what I’d learned at Amazon would even be relevant at Statsig.
Within three months of starting, Statsig had launched smart feature gates that out-classed the prevailing best in the industry. In addition to enabling phased roll outs, Statsig’s feature gates automatically produced AB test results in Pulse, which blew me away all by itself. Inspired by Facebook’s Deltoid, Pulse is refreshingly accessible and powerful: not the words one often sees together, either in the world of data science or product development.
From that point on, when I introduced Statsig to my friends and past colleagues, I said that we’re going to hand every product engineer in the world the lens of the world’s best data scientists. A few weeks later when investors started repeating that back to me, I nodded back happily.
Going into the July 4th weekend, we launched Experiments for A/B/n (multi-variant) tests, with built-in isolation for concurrent experiments. A raging debate has ensued internally about whether we should call it Experiments or Experiments+. The debate remains unsettled… I think we’re having too much fun for it to ever be resolved.
Coming from AWS, I’ve dodged some of the wildest curve balls on naming products¹, but I wasn’t even close to ready for naming products at Statsig. Designed to capture the aggregate impact of features shipped over a given period, ‘Holdouts’ initially sounded jargon-y to my naïve ears. Fortunately, I didn’t argue about it. But sensing that I didn’t know what I didn’t know, I went on an academic-paper-reading binge².
Following the paper trail led me into the rabbit hole of causal inference, but I didn’t have to look into the future to see how Statsig offers causal reasoning. In Aug, we launched Ultrasound, the antidote to thousands of fire-drills triggered at the sight of a dipping product metric. Today, product teams try to slice the data a hundred different ways to find a shred of correlation that might explain the dip. But what if we could automatically see what features or experiments have caused the biggest losses and gains for the metric? Ultrasound walks and talks like a true BFF for product teams.
From the beginning, our goal has been to arm every team member with the same product data and context as the highest paid person in the organization. As our customers have grown in number and size, they asked us for a way to manage a growing number of projects, team members, and member roles. In Nov, we launched Organizations, and this week we’re launching better Reviews to match existing processes and approval workflows when teams deploy to production.
Going All In
Whether we work or party, at Statsig we go “all in” (borrowing from Marcos’ favorite line). Going all in for our customers regularly brings the most satisfying moments for our team… like the time we launched a time series view of Pulse metrics with custom date range filters for a large financial services customer a week after they asked for it. Or the time when we launched User Flows and User Funnels for our favorite delivery app as their team worked on improving their purchase conversion. My personal favorite was when Tore began work on the Roku SDK for a large television network. That was three weeks ago. Notwithstanding the week at re:Invent, we released the Roku SDK last week. 🥳
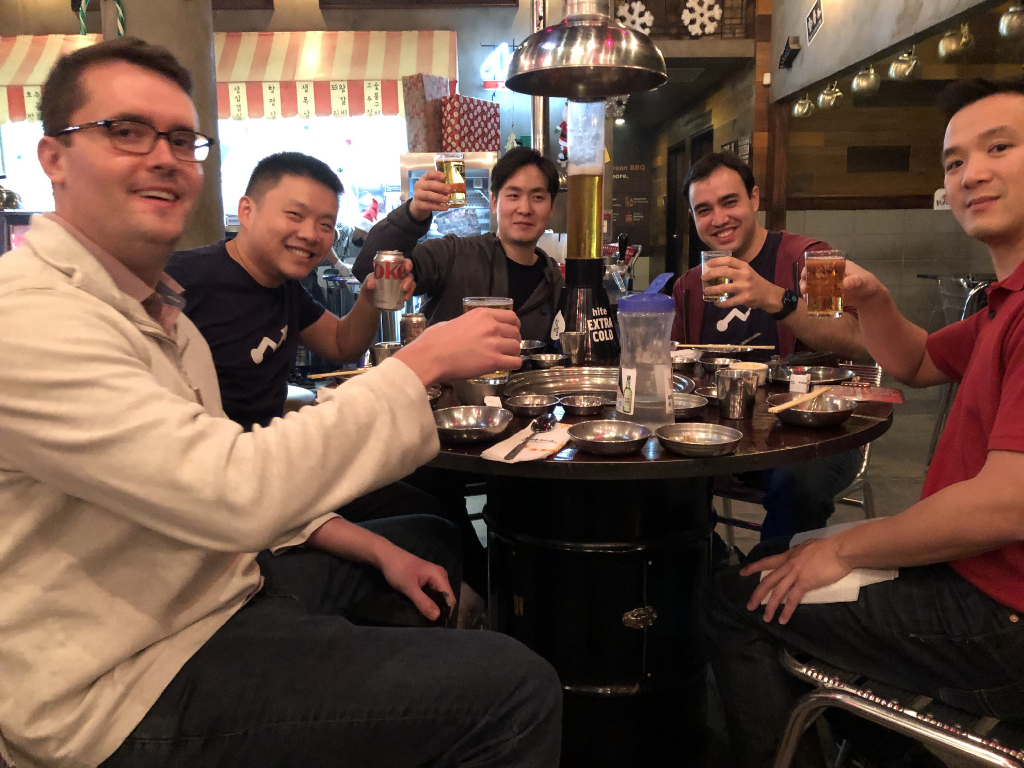
In all fairness, our all-in memoirs won’t be complete without noting the day we went all in on Korean BBQ. I don’t know how Geunbae "GB" Lee managed it, but this picture totally belies the ungodly amount of meat that we consumed that day.
But in the grand scheme of things, you haven’t heard anything about going all-in until you’ve heard from Tim about Autotune. Not to steal his thunder, Autotune codifies the multi-arm bandit algorithm to automatically select the best performing experiment variant as the winner. Watch out for his post on the making of Autotune!
Theme of the Year: Growth Today
As the year draws to a close, the biggest theme that we’re seeing across our customers is their focus on accelerating growth today, not next month or next year. Everyday, we work with teams that are hungry and ambitious: teams that are enabling more end-users to find joy in their products, and teams that are uncovering user preferences faster than their competitors. Seeing their growth and compounding competitive advantages never ceases to humble us.
To all our customers, thank you for your trust and partnership… and for being a part of the Statsig journey 🙏
To everyone else, please expect delays in getting to your growth.
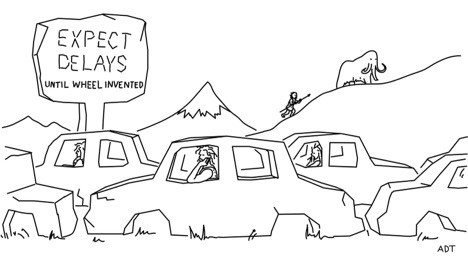
All cartoons are courtesy The New Yorker.
[1] I’d once proposed Yellow Knife as the code name for a product. It was fortunately shot down very quickly.
[2] I also read a bunch of books such as Trustworthy Online Controlled Experiments and The Art of Statistics.