Products
Solutions
Resources


Confidence level is a fundamental concept that plays a pivotal role in how we interpret the results of various statistical tests and experiments.
Whether you're a data scientist, a business analyst, or just someone interested in understanding the nuances of statistical inference, grasping the concept of confidence levels is crucial.
In this primer, we'll explore what confidence levels are, how they are used in statistical analysis, and the implications they carry for decision-making.
What is a confidence level?
A confidence level, in statistical terms, is a measure of certainty or assurance that a particular parameter lies within a specific range, which is known as the confidence interval. 95% is traditionally the standard.
It is expressed as a percentage and indicates how often the true parameter would fall within the confidence interval if the same experiment or study were repeated multiple times under the same conditions.
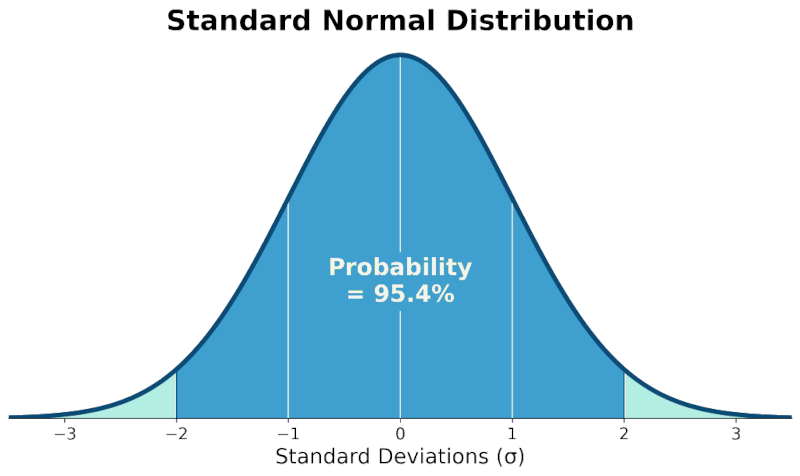
For example, a 95% confidence level suggests that if we were to conduct the same study 100 times, we would expect the true parameter to fall within our calculated confidence interval in 95 out of those 100 times.
It's important to note that this doesn't mean there's a 95% chance the current interval contains the true parameter; rather, it's about the long-term frequency of capturing the true parameter across repeated sampling.
Get more confidence!

Calculating confidence intervals
To calculate a confidence interval, you need three key pieces of information:
The sample statistic (e.g., the sample mean)
The standard error of the statistic
The desired confidence level
The confidence interval is then constructed around the sample statistic, extending a certain number of standard errors on each side.
The number of standard errors is determined by the z-statistic or t-statistic corresponding to the desired confidence level. For a 95% confidence level, the z-statistic is approximately 1.96 for large sample sizes.
For more complex metrics or smaller sample sizes, the calculation may involve additional steps or different statistical tests, such as Welch's t-test, which is more appropriate when dealing with samples of unequal size or variance.
Confidence level formula
Here's a simplified formula for a confidence interval around a sample mean:
CI = Sample Mean ± (z-statistic × Standard Error)
CI: This stands for "Confidence Interval." It represents the range within which we expect the population mean to lie, given our sample mean and level of confidence.
Sample Mean: This is the average value of your sample data. It is denoted by the symbol `x̄` (x-bar).
±: This symbol indicates that the confidence interval has two bounds: an upper bound and a lower bound.
z-statistic: This value corresponds to the z-score, which is the number of standard deviations away from the mean a data point is. The z-statistic is determined by the confidence level you choose (e.g., 1.96 for a 95% confidence interval).
Standard Error: This is the standard deviation of the sampling distribution of the sample mean. It is calculated by dividing the sample standard deviation (`s`) by the square root of the sample size (`n`), i.e., `Standard Error = s / √n`.
Implications of confidence levels
The choice of confidence level has several implications:
Precision vs. certainty: A higher confidence level (e.g., 99%) results in a wider confidence interval, reflecting greater certainty that the interval contains the true parameter but less precision about its value. Conversely, a lower confidence level (e.g., 90%) yields a narrower interval, offering more precision but less certainty.
Statistical significance: In hypothesis testing, a confidence interval that does not contain the null hypothesis value (often zero) indicates a statistically significant result at the chosen confidence level. For instance, a 95% confidence interval that doesn't include zero suggests a statistically significant effect with a 5% risk of a false positive (Type I error).
Interpretation: Confidence levels should be interpreted in the context of the study and the decision-making process. They provide a range of plausible values for the parameter of interest but do not guarantee that the true value lies within any single interval calculated from one sample.
False positives: Even with a high confidence level, there's always a chance of observing a statistically significant result by random chance alone. This is known as a false positive, and the risk is equal to 100% minus the confidence level.
Confidence levels are a tool for informed decisions
Confidence levels are a cornerstone of statistical inference, providing a framework for understanding the reliability of our estimates and the results of our tests. By choosing an appropriate confidence level and interpreting the resulting intervals correctly, we can make more informed decisions based on data.
For those looking to dive deeper into the topic, consider exploring resources on hypothesis testing, the interpretation of p-values, and the nuances of different statistical methodologies.
The official documentation from Statsig, particularly their sections on Confidence Intervals and Standard Error, offers valuable insights and examples that can further enhance your understanding.
Remember, confidence levels are just one part of a larger statistical puzzle. They should be used in conjunction with other tools and techniques (like CUPED) to draw meaningful conclusions from data.
⚠️ Related reading: For a data scientist’s opinion on the 95% confidence interval, check out this article by our Lead Data Scientist, Tim Chan.
Get a free account
