Products
Solutions
Resources


You don’t experiment for wins
In discussions around online experimentation, it’s common for proponents to point to legendary wins that have come out of a/b testing programs:
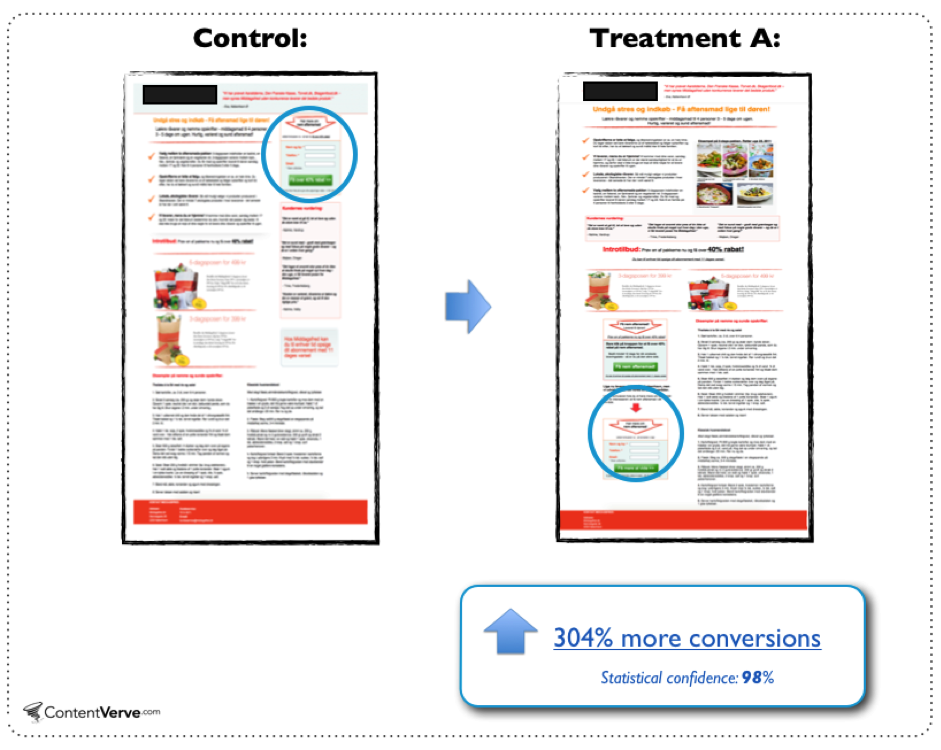
This FOMO-engendering content has a point. Experimentation is a valuable tool for understanding what kind of changes work for your product; with that knowledge in hand, you can more reliably pick a good future direction.
However, in practice—and especially in product experimentation—the real wins come from not losing. In scaled experimentation programs, the facts are that the majority of experiments fail to achieve their goal, and a significant portion are actively unproductive. A smaller company shipping even half of their experiments is pretty impressive!
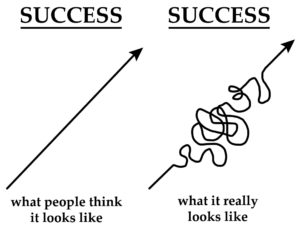
Chasing rainbows: The illusion of the big win
Understandably, the appeal of the 'big win' is intoxicating. A minor tweak that leads to a 20% increase in conversion rates or a UI adjustment that boosts customer engagement by 50% are the stuff of legend. These stories dominate experimentation folklore (such as it is) and inspire the constant pursuit of the next “one weird trick” for your product.
The unpalatable truth is that these victories aren’t common, and are frequently incorrect. There are a number of contributing factors:
Twyman's Law: an unexpected result is one you should be skeptical of. Many times, a huge win represents an issue with experimentation setup like sample-ratio-mismatch, a bias in exposures, or a logging issue that misrepresents what’s happening in the product
Novelty effects on short experiments: especially when you’re changing UI elements, repeat users will click on the “new thing,” but these effects quickly diminish back to the baseline after a week or so.
Poor evaluation criteria: most of the examples you’ll see here are button clicks. These are a great first order metric, but the general truth is that an increase in clicks rarely fully translates into a proportionate increase in a business’ topline objectives
Maintain a healthy skepticism towards positive results. It's human nature to embrace good news, but you should ask questions. Why did the metric go up? If revenue moved, did purchases go up, or average dollars per purchase? If neither, something’s fishy. Which users are driving this change?
The fact of the matter is that when you measure your changes with a holdout, the real cumulative impact (as measured by the holdout) is almost always less than the sum of the “point estimates” of the individual changes made—and often dramatically so.
Cherry-picking your evaluation metrics, rerunning “neutral experiments” with trivial changes until they look good, and ignoring regressions and externalities all contribute to this phenomenon. Vigilance helps to curb it.
A penny saved is a penny earned
Most tech products were intentionally designed by somebody. Accordingly, the general truth is that improvement is nontrivial—this is why people need to test their ideas. There are many ways an idea can actually be negative for a product—for example:
Product owners use the product differently than the typical user, which skews their intuition and causes them to design unhelpful features
New features negatively impact product performance—especially in web development, minor slowdowns can have huge revenue implications
People developing one area of the product don’t have the context to consider how it will negatively impact other areas of the product
Changes frequently introduce bugs that break experiences for users
A salient example comes from Rec Room. By observing a negative movement in experiments, they prevented a 35%+ regression and were able to change it into a 10%+ win. It’s likely they would have eventually caught this change, but in a vacuum, this is functionally a 110/65 = 69% improvement from if they just shipped the original change. Reflecting on this, their head of data had the takeaway that
It's much easier to have significant negative metric movements than positive ones […] We should celebrate preventing negative metric movements as much as we celebrate the positive ones. (Source)
Joel Witten, Head of Data, Rec Room
From a strategic perspective, preventing a 20% regression is the same as a 25% lift if that regression would have shipped without being caught. Even if it is eventually identified and patched, that takes valuable time and resources away from your team and thrashes your users in the meantime.
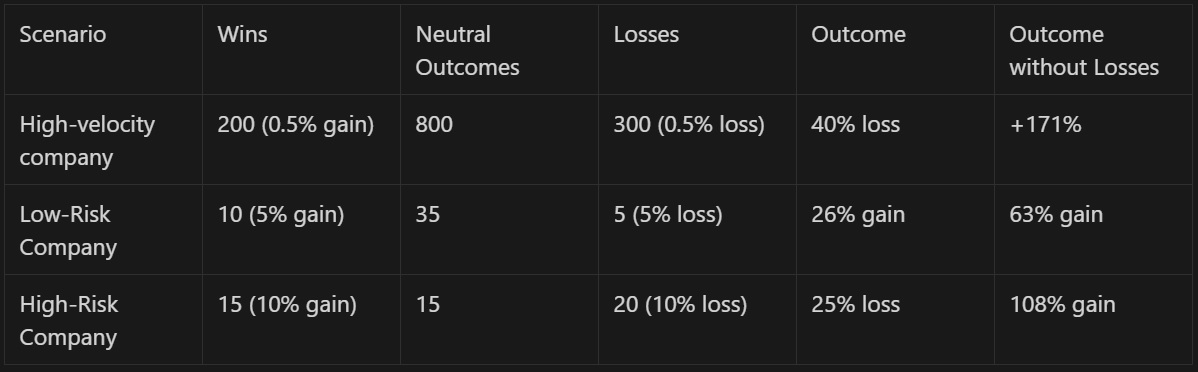
Even if your product changes has an amazing success rate, if you ship 80 1% wins in a half, and 20 2% losses, you’d end the half up 48%. If you didn’t launch the 20 bad changes, you’d end the half up 122%. That’s tripling your impact. In a realistic world it’s even more dramatic:
Rec Room launches critical features

Show me the data
On Statsig, experimenters specify their primary metrics (or “OEC”) as well as secondary guardrail metrics on every experiment.
If we look at the corpus of the experiments on the platform, about as many experiments have a negative (Statistically Significant) result on those metrics as have a positive result—between 6-15% of metrics depending on the company and the kinds of experiments being run.
Importantly, the median negative movement is larger than the median positive movement. This means that when things break, they tend to break badly—so catching them is critical! Negative outcomes are a reality of trying new things, and managing this well is a critical part of long-term success.
Putting this into practice
Observing regressions in your experimentation begins with the selection of strong guardrail metrics—measures that ensure your improvements in one dimension aren't causing inadvertent harm in another. This is especially important for surface level changes—in the example above with conversion rate, a wise experimentalist would want to understand if the overall signup rate went up (and if the rate of click to signup went down).
In addition, you should aim to measure ecosystem metrics in every experiment. Ecosystem metrics include core metrics for different product areas as well as measures of—or proxies for—overall business objectives. By checking these on every change, you can significantly reduce regressions on the things that your business cares about.
Picking guardrails and ecosystem metrics can be difficult, and we all have blind spots. One way around this is to calculate a broad corpus of metrics. By analyzing more metrics, you’ll miss less regressions and also have tools to understand odd results you might see. The downside is that this can be expensive—it requires a lot of investment in experimental infrastructure to keep costs manageable. At Statsig, we strongly believe in this step—we calculate all of an organization’s metrics on every experiment by default to give full visibility into feature releases.
Refocusing your experimentation program
Let’s recalibrate the discussion on experimentation a bit. Yes, we should strive for wins—they're necessary to move products forward—but let's also remember the importance of staving off losses and celebrate preventing them.
Instead of using experimentation to search for wins, use it as a tool to holistically measure all of the changes you consider. At the end of the half, add up your shipped impact and tally it against the prevented regressions—I’m curious about what you’ll see.
Get started now!
