Products
Solutions
Resources

A/B Testing In Flutter
The following tutorial builds upon the Startup Name Generator app outlined in the Write your first Flutter app tutorial on Flutter’s codelab. If you haven’t yet, it is recommended to follow that tutorial first.
Overview
In the base tutorial, we created an app that randomly generates names that could be used for a startup. In this tutorial, we are going to log user selections and add an experiment that will show an Emoji icon as a possible start logo, in the hopes that this will drive user engagement. To do this, we will be using Statsig via the Statsig Dart SDK.
Installing Statsig
First off, we will need to add the Statsig SDK to our app. In a terminal window, run the following:
This will install the latest version of the SDK.
Initializing the SDK
Statsig requires an async call that hits the network to fetch all the values for the given user. This async call must be completed before checking any gates or experiments. There are a number of places we could put this call (See Flutter async), but we’ll just stick it in an async main function.
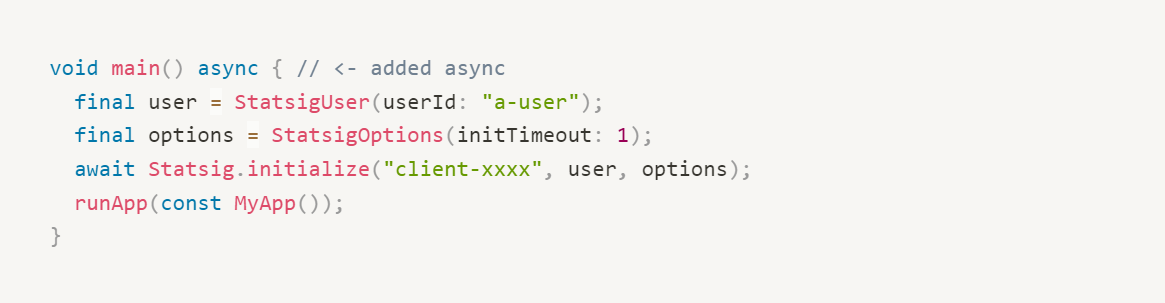
Now when our app is launched, Statsig will make a network call and fetch all the values for our given user.
Logging the Event
To drive user engagement, we must first have some way of measuring an engaged user. This could be a metric that counts how long a user spends in the app, or the number of times a user returns to the app.
In this tutorial, we are going to opt for a simple event to fire when the user engages by selecting a startup name from the list.
Let’s add an onTap action to be fired whenever a user taps on a ListTile in our ListView:

Now if we run our app, we can select a name from the list and an event will be fired to Statsig. We can verify this is working in realtime by going to our Statsig console and checking the metrics page.
Setting up an Experiment
Now that we have a metric for an engaged user, let’s create an experiment to drive this metric.
Let’s update our UI to display the emoji as our startup logo. Similar to how the name suggestions work, we’ll create a list of emojis as strings:
Then in our build method, we will check the experiment and populate the list.

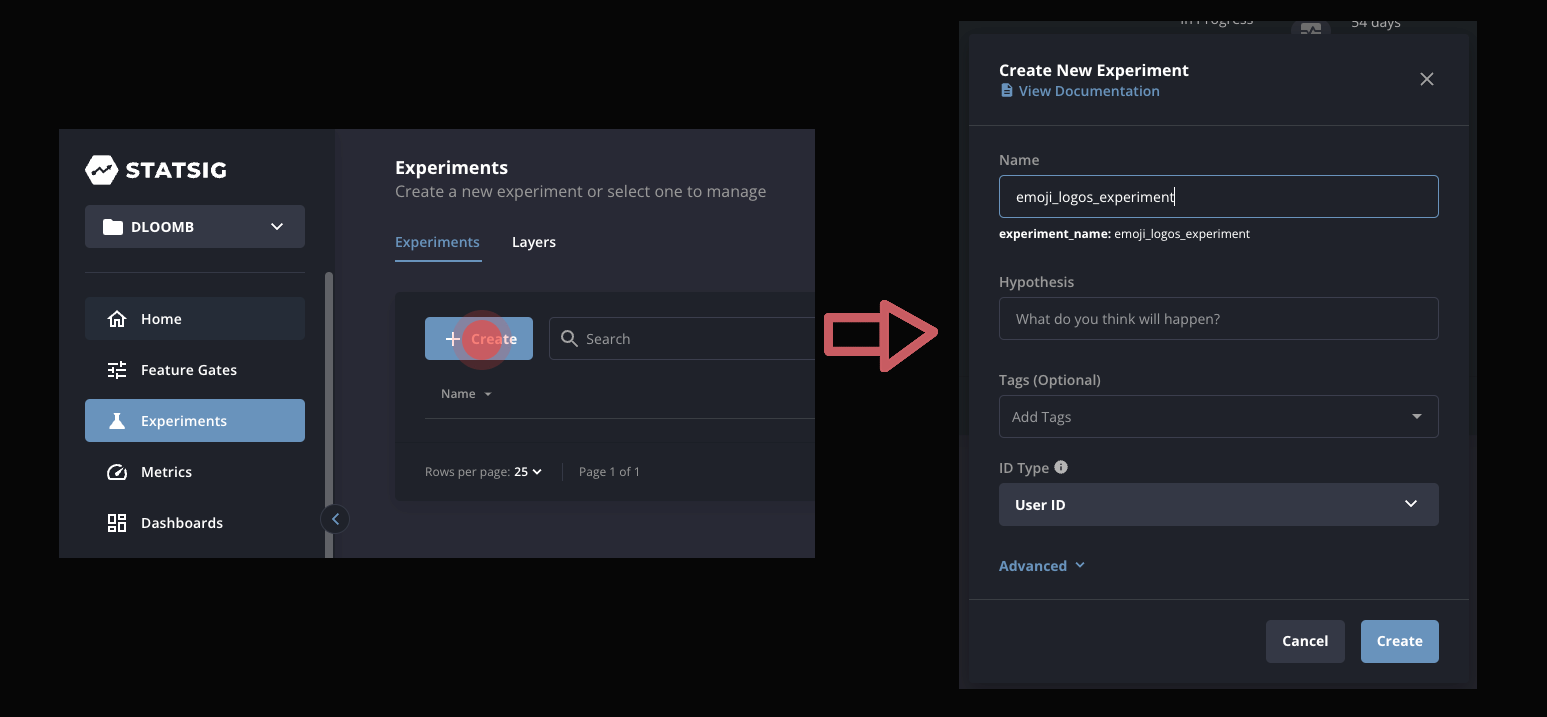
Here is what the experiment setup looks like on console. For more information on how to set up an experiment, see our documentation.

Running the Experiment
And that’s it! If we put this code in front of our users, 50% will see the Emojis (Test) and 50% will not (Control).
After a few days of running, we should see results from our experiment, hopefully showing that adding emojis increased our “selected_name” metric. The completed tutorial project can be found here.