Products
Solutions
Resources

"Let’s use a coin toss to decide—first to 50 wins."
Imagine we’re flipping a fair coin several times and get 8 heads and 2 tails. (A fair coin is a balanced one, and has never been used in a magician’s routine.)
While we would expect to get half heads and half tails, we might have just gotten weird results. If we keep flipping the coin for 100 trials and get 80 heads and 20 tails, we’ll be much more suspicious about the “fairness” of this coin.
If we’re using this coin flip to randomly assign users to the test or control group of an experiment, the lack of “fairness” is called sample ratio mismatch or SRM.
We evaluate this lack of fairness with a chi-squared test comparing the 80/20 results we’re seeing to the 50/50 results we would expect from a fair coin. The p-value from this chi-squared test is the rate of results as or more extreme than what we observed we would expect to see in repeated trials with a truly fair coin.
Intuition maps to SRM p-value
The intuition from our coin flip experiments is reflected in the p-value of the chi-squared tests for each of these instances. Seeing results of 80% heads in a 10-flip experiment has a p-value of 0.058, while getting 80% heads in a 100-flip experiment has a p-value of essentially 0.
Why is SRM bad?
Sample ratio mismatch is evidence of selection bias
One of the fundamental assumptions of random experiments is that there is random assignment of individuals to the control or test group. Otherwise, there could be other variables that are not independent of assignment that could be the true cause of any differences between treatment and control that we observe.
Points to an implementation issue
The fact that there is SRM likely means that there is some issue in the experimentation implementation, but it could occur in either the way users get assigned to their treatment group or how the data is measured or processed after the fact. If you’re using Statsig, there’s also lots of these potential causes that we can probably rule out!
A few causes to investigate:
Some users aren’t eligible for some variants: maybe the code for your super cool new feature also inadvertently forces certain segment of users into a specific treatment group.
This won’t happen if you’re using Statsig because our SDK filters out ineligible users evenly across all experiment groups
Enrollment is decoupled from exposure: Perhaps users are enrolled in an experiment on a certain webpage but are only exposed to their treatment group if they reach the relevant experience. However, if the control group’s exposure happens at the top of the page but the test group needs to scroll, this is a mechanism that could cause SRM.
Statsig SDK automatically couples assignment and exposure by logging exposures automatically for you by default, but this also can be decoupled when needed.
The randomization procedure isn’t random-ing: the function that you’re using to assign users ‘randomly’ to a treatment isn’t actually random and is potentially introducing bias.
This won’t happen if you’re using Statsig - we use the SHA256 hashing algorithm to deterministically assign treatment groups given a unit ID and experiment ID
Crash rate differences between Test and Control groups: If the new code introduces or resolves crashes, this could result in SRM. If the test group has more crashes, this would result in more users in the test group being unable to send exposures over, causing SRM.
Data processing issues: there may be some process by which this data is being deleted or duplicated for only the control or test variant.
If you’re sending all your data through Statsig, we do the data processing and there shouldn’t be SRM coming from data processing
Were you just super unlucky?
Probably not.
This is what the p-value is quantifying: the rate of results where groups are divided at least as extremely as what we observed that we would expect to see in repeated trials conducted in the same way. This is really unlikely but could be what’s happening.
SRM in the Statsig Console
In Statsig we automatically check for SRM for every experiment. In Diagnostics, under Experiment Health Checks, if you see that Exposures are Balanced is green, that means that we didn’t detect any SRM.
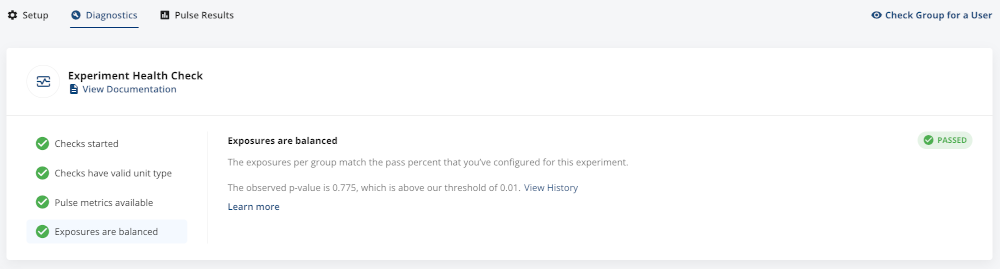
We consider exposures to be unbalanced if the SRM p-value is below 0.01.
If you’re not using Statsig, and want to check if your experiment has SRM, you probably don’t want to do a chi-squared test by hand. I’ve used this SRM calculator before and used it to calculate the p-values for our (8, 2) and (80, 20) examples above.
Statsig automatically tracks your SRM p-value over time, which allows you to identify if/when you see evidence of SRM. Any SRM p-value below 0.01 will mean that the experiment fails the Exposures are Balanced health check.
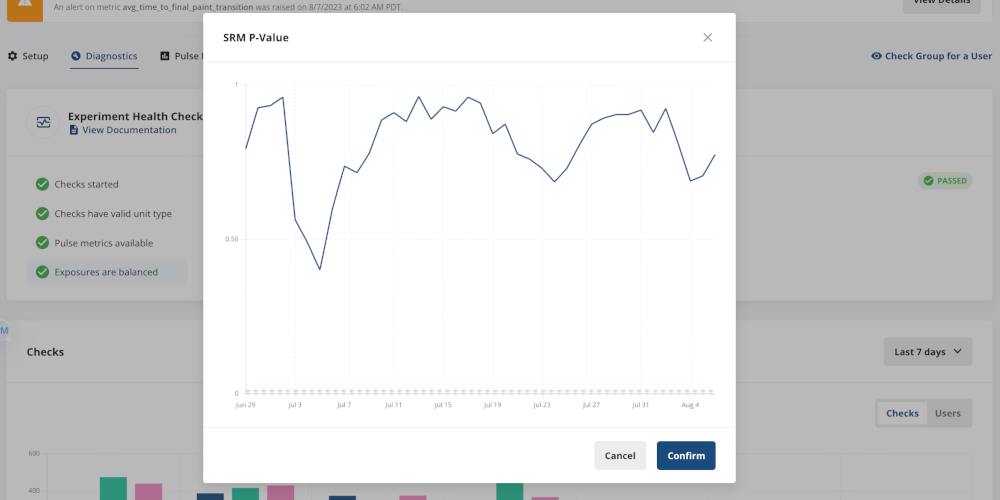
This means that there’s also a starting point for debugging issues that may have caused the SRM.
If SRM is detected and the root cause is found, you can easily abandon the experiment and reallocate. This will new experiment with the same design will also have a different "salt" used to randomize a user's group, meaning that users are randomly assigned to a group independent of their group in the previous iteration of this experiment. This is important, because it makes sure that the new result is not impacted by a negative or positive experience in the previous run.
Follow Statsig on Linkedin

Do I have to throw away my results because I have SRM?
We don’t want to take lightly the existence of SRM in an experiment. It indicates that there is very likely something methodologically wrong in your experiment. However, we may not want to completely disregard the experiment we just ran.
Importantly, I need to know the root cause of SRM when making these judgment calls. Without this crucial knowledge, it is impossible to consider the potential sources of experimental bias and in what ways we feel comfortable using results.
There are a few factors I consider when I’m looking at an experiment with SRM to determine whether or not I can glean any directional insight from the experiment:
How different is the group of users causing SRM from other users?
e.g. in our experiment, new users are all in the test group, and new users behave very differently from tenured users, so I completely disregard the experiment results and restart the experiment.
Could the difference between users that is causing SRM also impact the treatment?
e.g. in our experiment, I have duplicated entries for all Internet Explorer users for whom my new feature causes higher latency. This seems to be driving the negative results I see overall, while users with other browsers seem to have a small positive impact from the new feature. This may lead me to iterate on my product to reduce latency across all web browsers before running another experiment.
At the end of the day, it’s a judgment call.
Introducing Product Analytics

While there may be drawbacks to re-starting an experiment and taking no learnings from the previous version where SRM was present (delayed decision-making, serving an inferior experience to users) the most scientifically rigorous approach would be to always re-run these experiments as they were designed once the issue causing SRM is found.
If you want to consider the results of an experiment despite the existence of SRM, controlling for pre-experiment bias using CUPED may help in addressing bias.
Related:
Join the Slack community