Products
Solutions
Resources


We’ve collaborated with dozens of the world’s most successful digital experimentation programs in search of the keys to success.
In this search, we’ve observed some reoccurring themes: Trusted and complete data, accessible data, and automated analysis.
Using Statsig and Snowflake, you can repeat these patterns, and increase the efficiency and effectiveness of your digital experimentation program, without over-consuming data science and engineering resources.
The points of friction
Incomplete and untrustworthy data. Successful experimentation programs reduce their exposure to brittle architecture and data quality risk.
Inaccessible data. Do practitioners have the data where they need it? Do they understand what the data represents and where it came from?
Manual analysis increases manual workloads and delays experimentation motions.
While experimentation programs may have varying business goals, there are patterned approaches that we find that ensure trusted and complete data, accessible data, and automated analysis.
Foundational success patterns
360-degree user views
Building a 360-degree view of your users involves consolidating and cleaning your data, enriching it with additional information, analyzing and segmenting it, and using the insights you gain to further invest in customer experience.
This data typically includes data from your application, model outputs, CRM systems, marketing automation tools, social media platforms, and other sources. Accurate and thorough data collection is essential for ensuring the validity of your analysis.
Data accessibility
By ensuring that data is well-documented and easy to access, organizations can help to promote the valid use of data and support the development of trusted outputs.
Data documentation might include metadata (such as the date the data was collected, the source of the data, and the methods used to collect it), as well as clear and detailed explanations of the data's structure and content. Data accessibility is built using appropriate data collection methods and tools, and properly recording and storing this data.
Automated analysis
Automated analysis is an important tool for organizations that need to analyze large and complex datasets quickly and accurately.
Using automated analysis, organizations can gain insights faster from their data and make more informed decisions. Analysis includes a wide range of tasks, such as data cleaning and preprocessing, statistical analysis, building consumable readouts, and data visualizations.
How to get started
Consolidate user data in Snowflake
We have observed that Snowflake Data Cloud serves as an effective engine to power a 360-degree customer view and mobilize this data because of Snowflake’s mature integration ecosystem, secure data accessibility, near unlimited scale, concurrency, and performance.
You can have Statsig pull raw data from Snowflake, or using Statsig Warehouse Native, you can calculate intermediate results fully within your warehouse and only export a small, aggregated, and anonymized dataset that's displayed in your Statsig console:
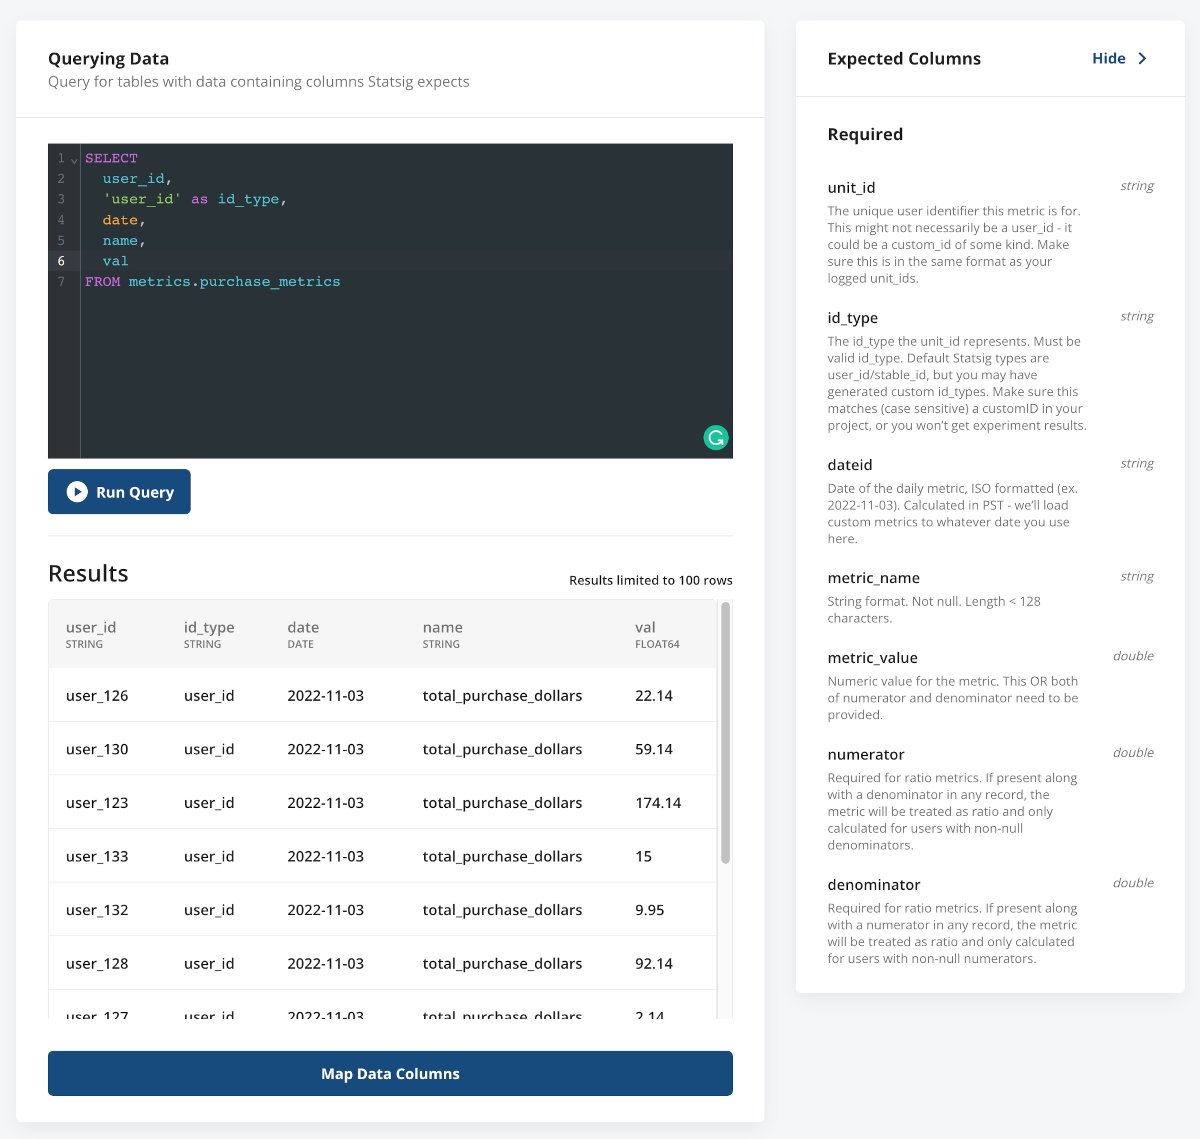
You can pull events, pre-computed metrics or exposure data from Snowflake into Statsig.
Use Statsig (a Snowflake-connected app) to create, launch, and measure experiments
Advanced user targeting
Using Statsig’s Feature Gates, you can select the criteria for identifying your target users in several ways:
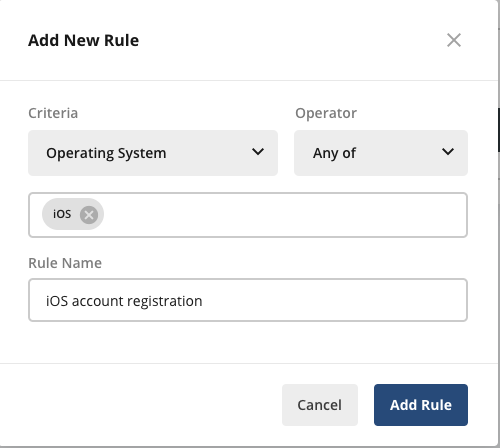
You can target users based on common application properties such as the operating system that the application is running on as shown below:
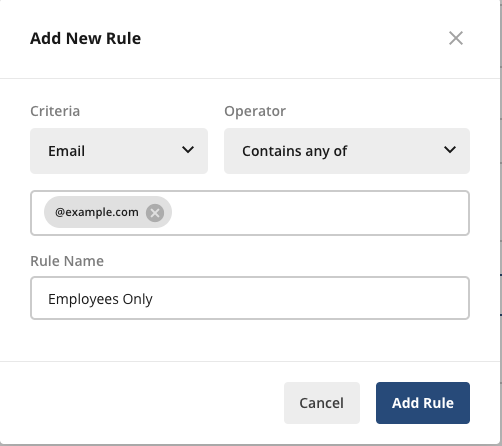
You can target users based on key value attributes; for example, you can select the user's Email attribute and the Contains any of operator, and enter the email domain of your company to target only internal employees as shown below:
You can target users in a defined segment.
You can also target users who are eligible for another feature gate; this ensures that this feature gate is activated only for users who pass (or fail) the selected target gate check.
Join the Slack community

Scheduled Rollouts
Scheduled Rollouts add a time-based scheduling layer to Feature Gates, enabling you to pre-set any rollout schedule you want, which will execute automatically. This is particularly useful if, for example, you have a feature launch happening in another timezone (and don’t want to stay up all night!) or you have a standard, company-wide ramp-up schedule you follow with every feature release.
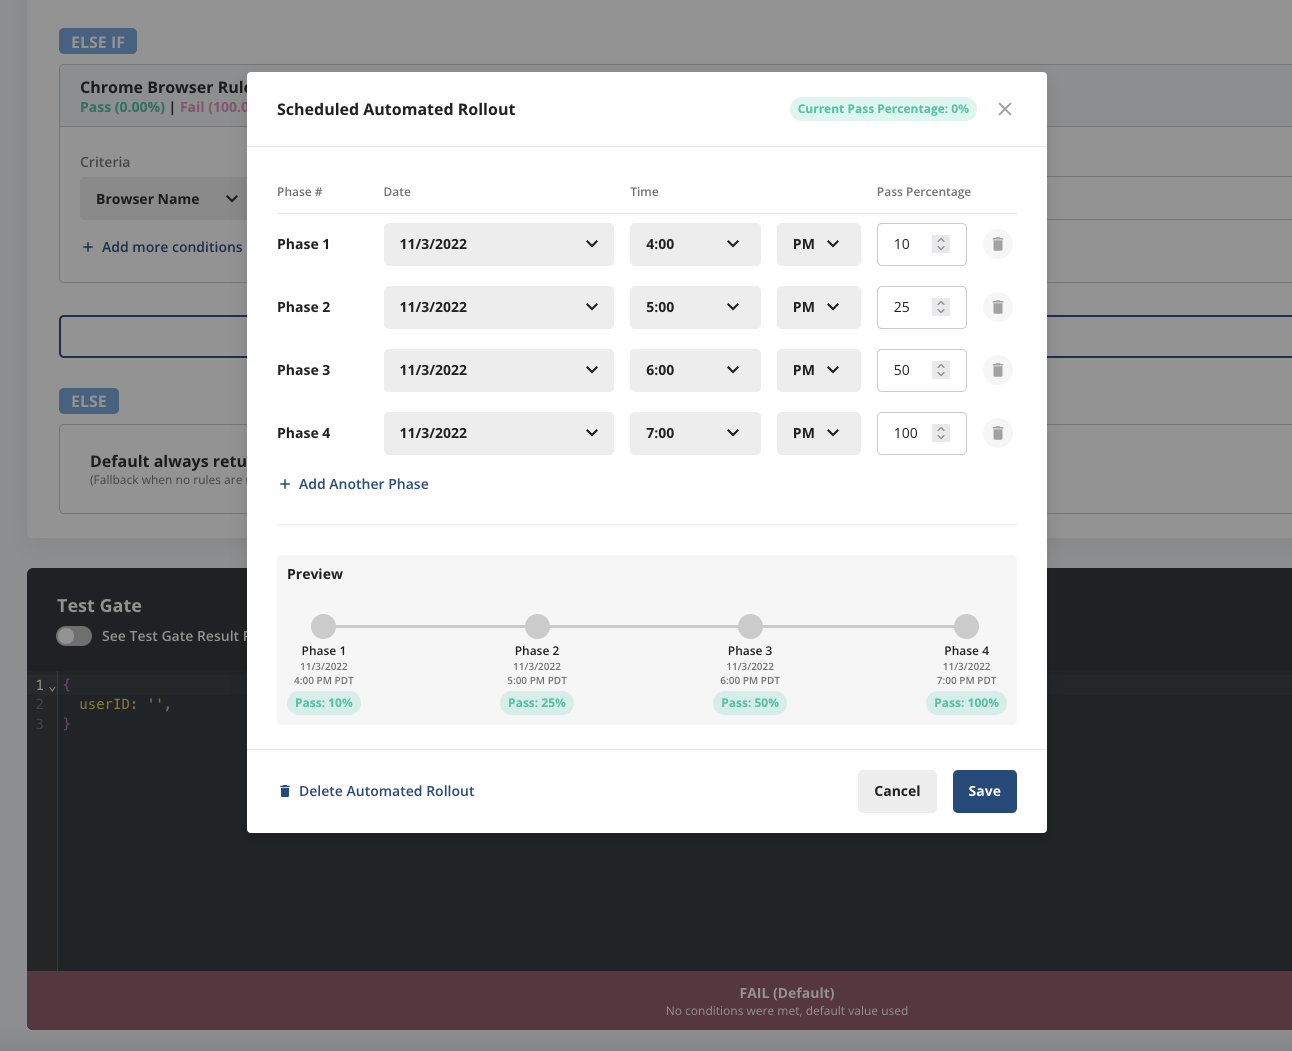
Statsig will then measure metric deltas for all users that are seeing the new feature, and allow you to decide if it’s worth shipping the new feature based on this data, or kill the feature if it is degrading guardrail metrics.
Experiments
Similar to A/B tests, Experiments provides the following features to run and analyze experiments with ease:
Automatically compute the sample size required to achieve statistical significance for a given experiment.
Configure allocations to define what proportion of eligible users are exposed to each variant in the experiment.
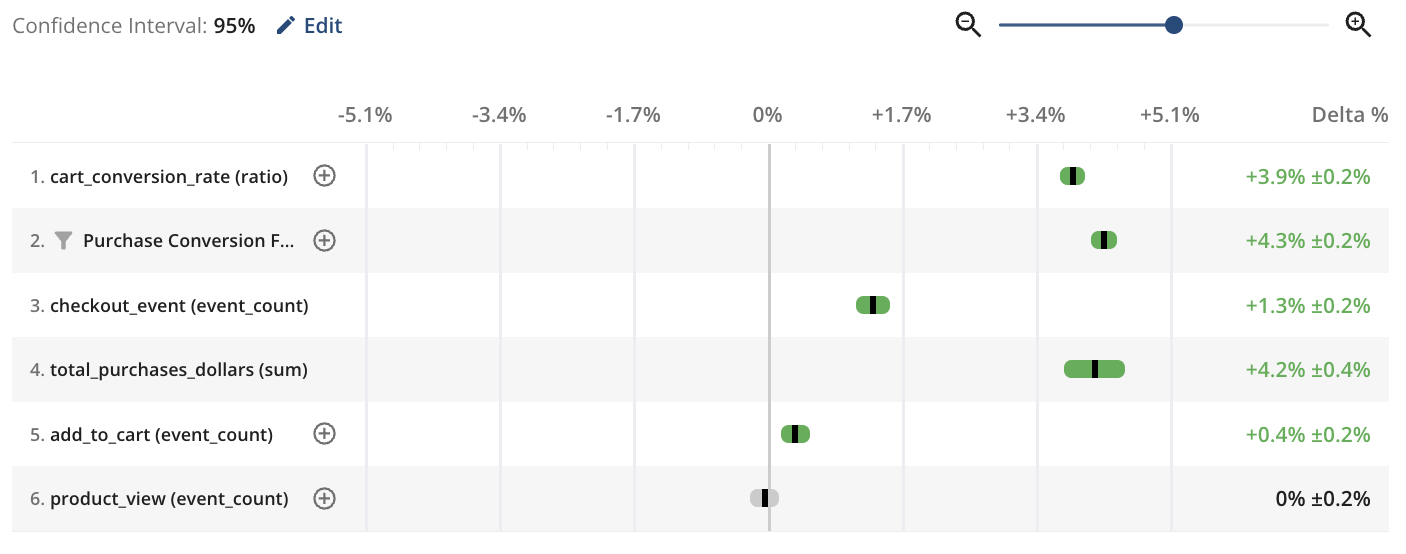
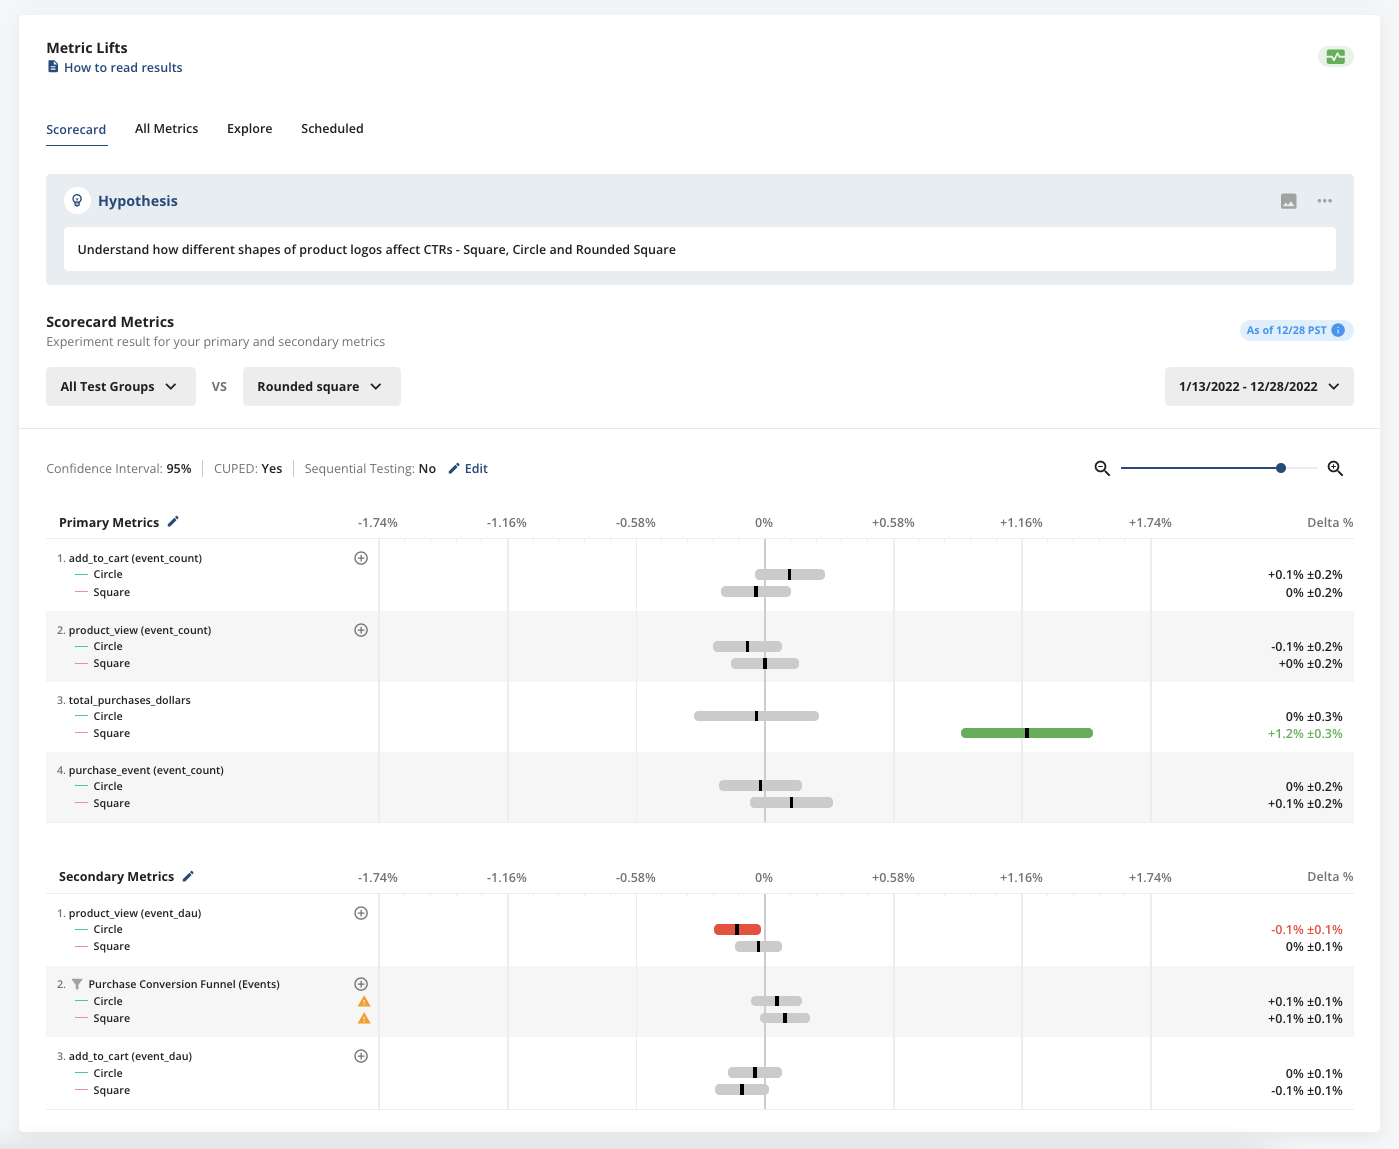
Review the Metrics Lifts and confidence intervals for all your business metrics.
Choose confidence intervals ranging from 80% to 99% depending on the confidence you need for your decision; a larger lift (say 20%) generally requires a lower confidence interval (about 80%), while a smaller lift (say 1%) generally requires a higher confidence interval (95%)
Analyze Metrics Lifts for different segments by filtering for dimensions such as operating system and browser version.
Use the Statsig client or server SDK of your choice to implement the experiment in your application.
Experiments offers additional features to accelerate and scale your experiments:
Create multiple variants as part of the same experiment (A/B/n tests)
Define layers to exclude the users participating in one experiment from other related experiments
Select the key metrics that you want to prioritize for your hypothesis
Request a demo

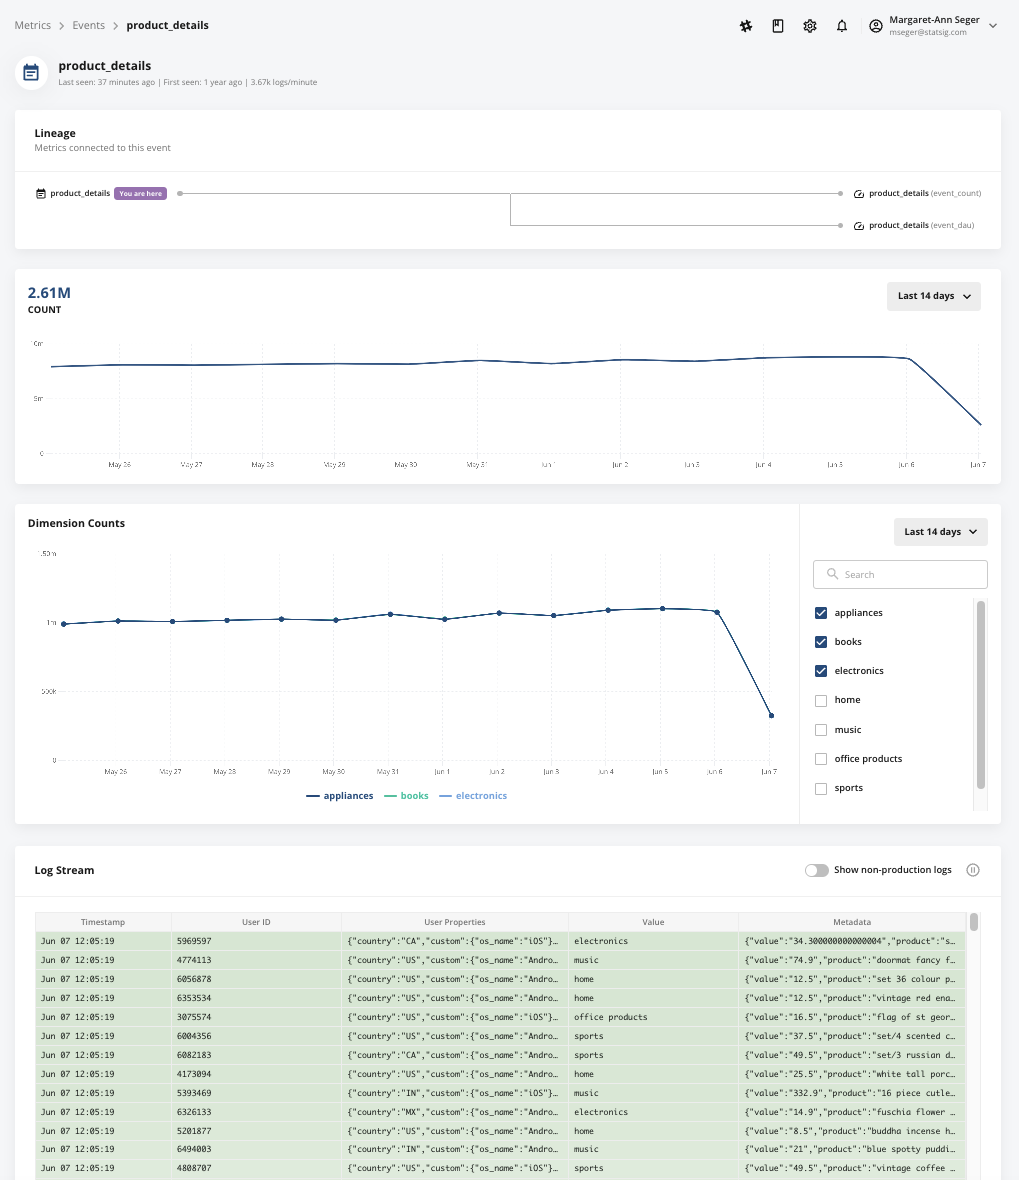
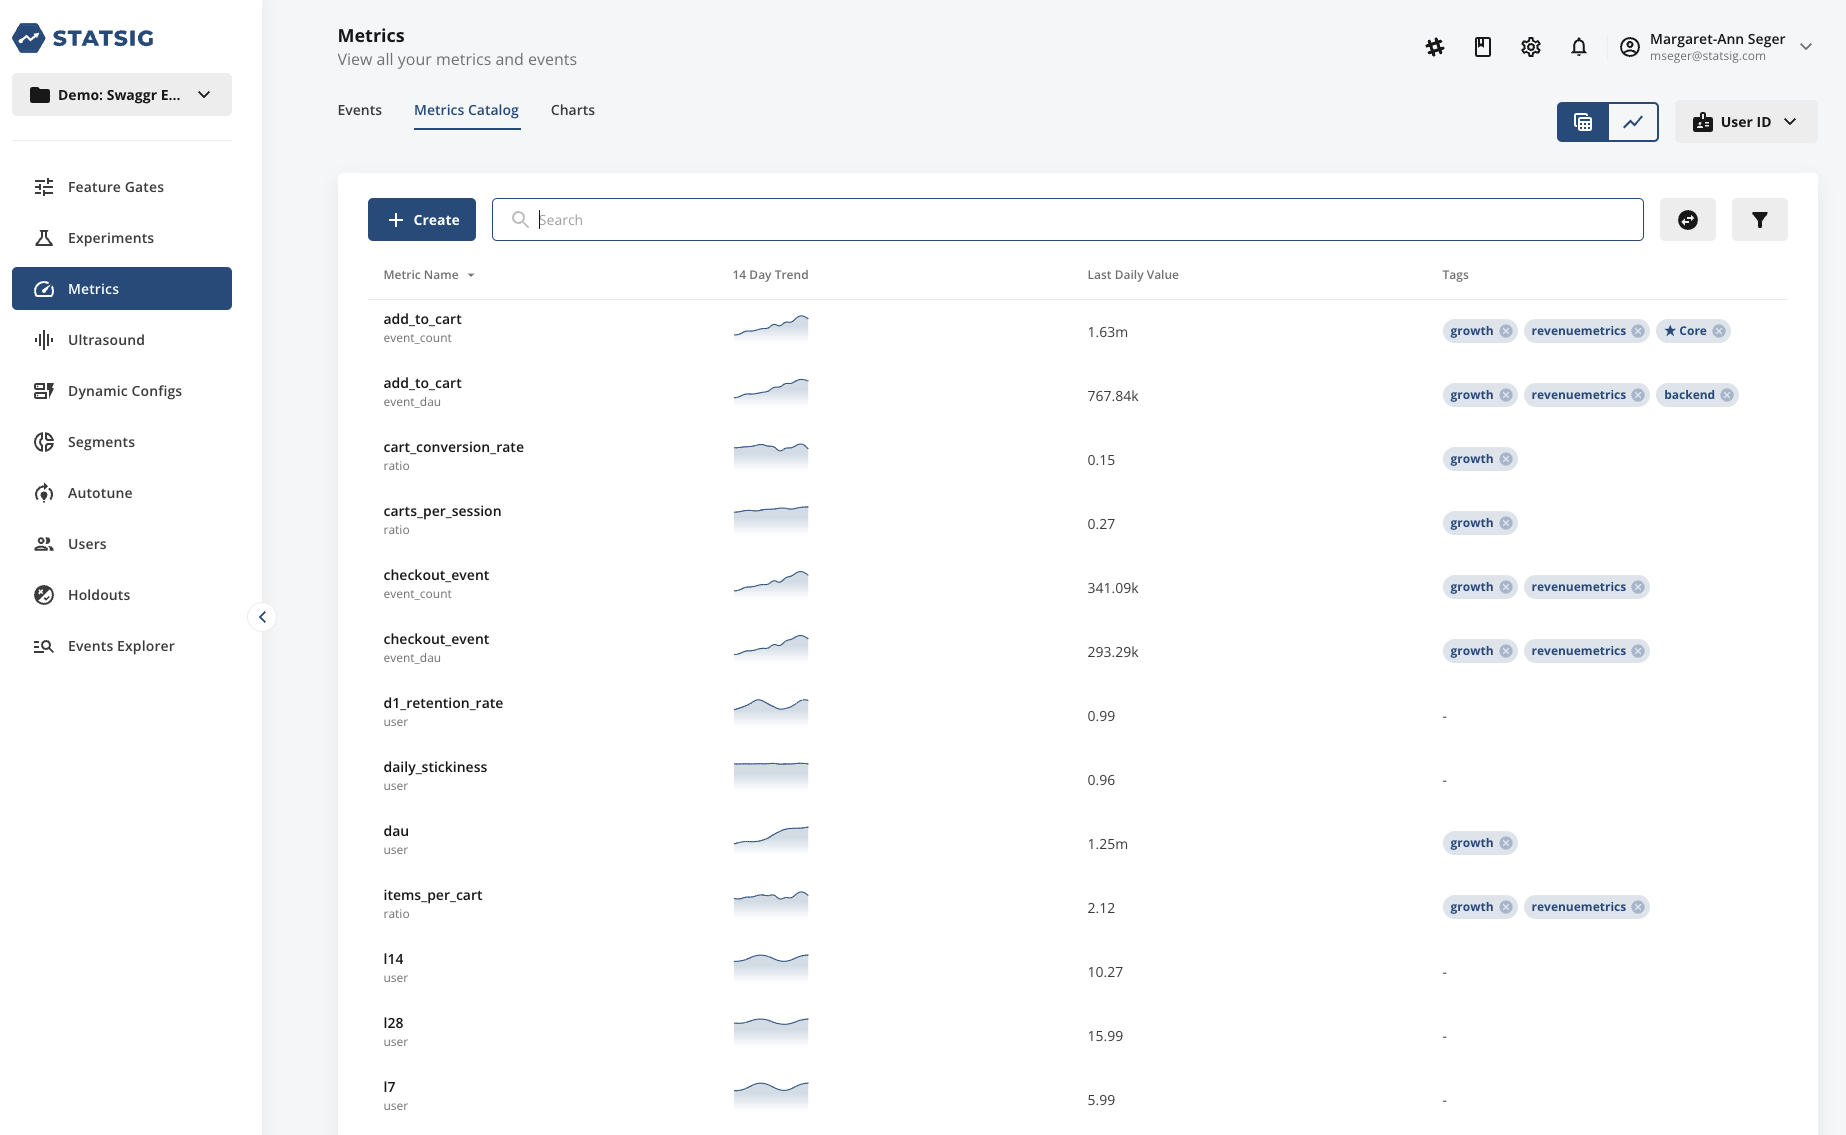
Metrics catalog
Statsig provides data observability and accessibility by combining data from any of your existing data sources to give you a complete view of your product metrics as well as the impact new features and experiments have on these metrics. This includes data from Snowflake, data collectors (like Segment, Rudderstack, etc.), and data using Statsig’s SDKs.
Statsig automatically creates metrics from the raw events that you log from your application as well as raw and transformed events you send to Statsig via a data collector.
Statsig can also reuse your existing precomputed metrics by natively integrating and pulling data from Snowflake.
Then, Statsig builds a Metrics Catalog that allows you to search and tag your metrics, as well as create custom metrics. Tags enable you to organize your metrics and create collections of metrics that are associated in some way.
For example, you could tag a set of metrics focused on a product area, business function, business objective, and so on. You can also create a loose collection of guardrail metrics that teams check in every experiment to ensure there are causing no unexpected effects in other parts of the business.
Once you create a tagged collection of metrics, you can easily pull up this set of metrics when viewing your experiment results and zoom into the context that you want to focus on.
Data-driven growth is now accessible to everyone
The combination of Statsig and Snowflake makes data-driven growth accessible for businesses of all sizes. Statsig's ability to quickly and easily analyze large amounts of data, combined with Snowflake's powerful data cloud capabilities, allows businesses to gain insights and make data-driven decisions with ease.
This combination not only saves time and resources, but also allows for more accurate and informed decision-making, leading to sustainable growth for businesses. By leveraging the strengths of both Statsig and Snowflake, businesses can stay ahead of the competition and make data-driven growth a reality.
Get started now!
