Products
Solutions
Resources


We were ho-ho-hoping to spread some holiday cheer, but we distributed something else instead. 😬
As the holiday season of 2023 approached, Statsig embarked on a unique and engaging journey with our customers and friends, the "Hot Takes on Hot Chocolate" experiment.
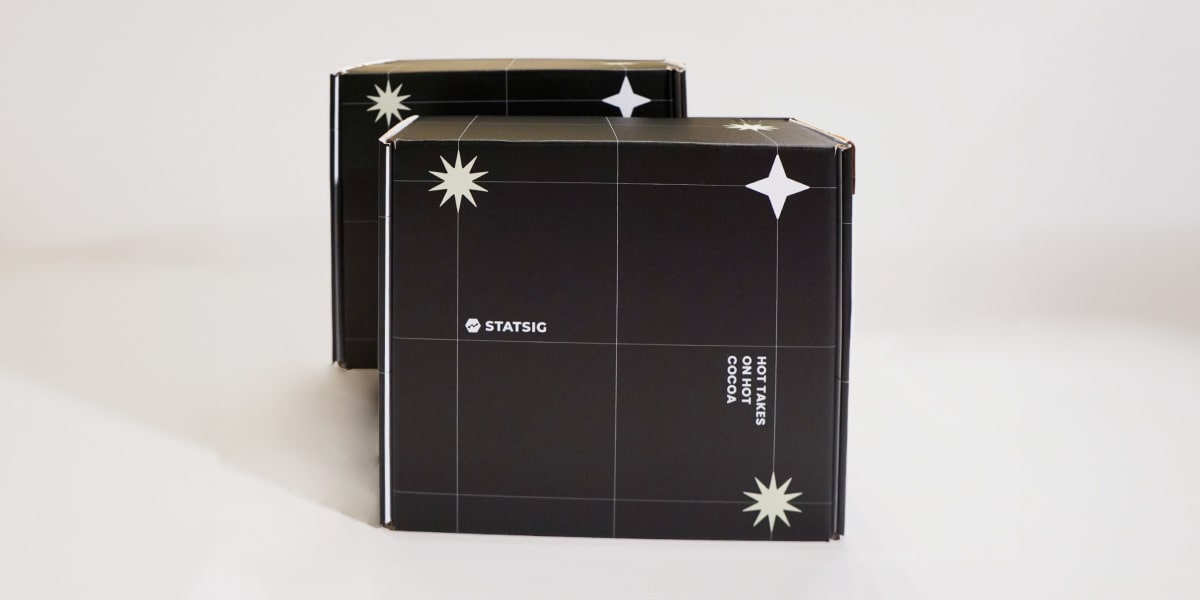
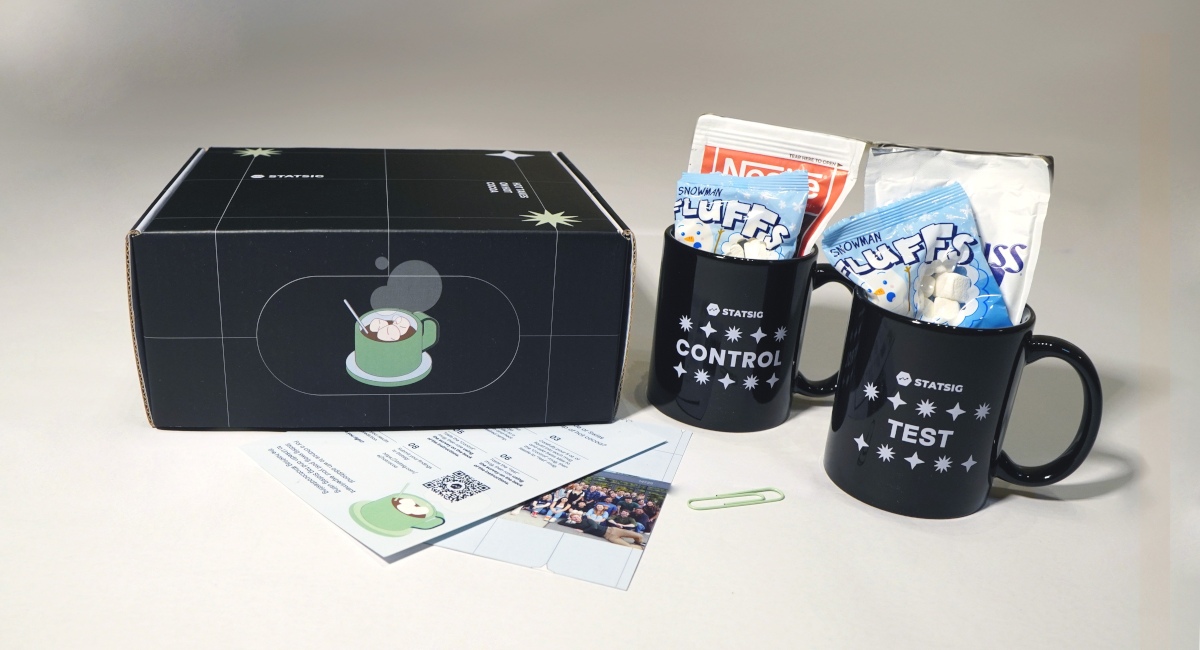
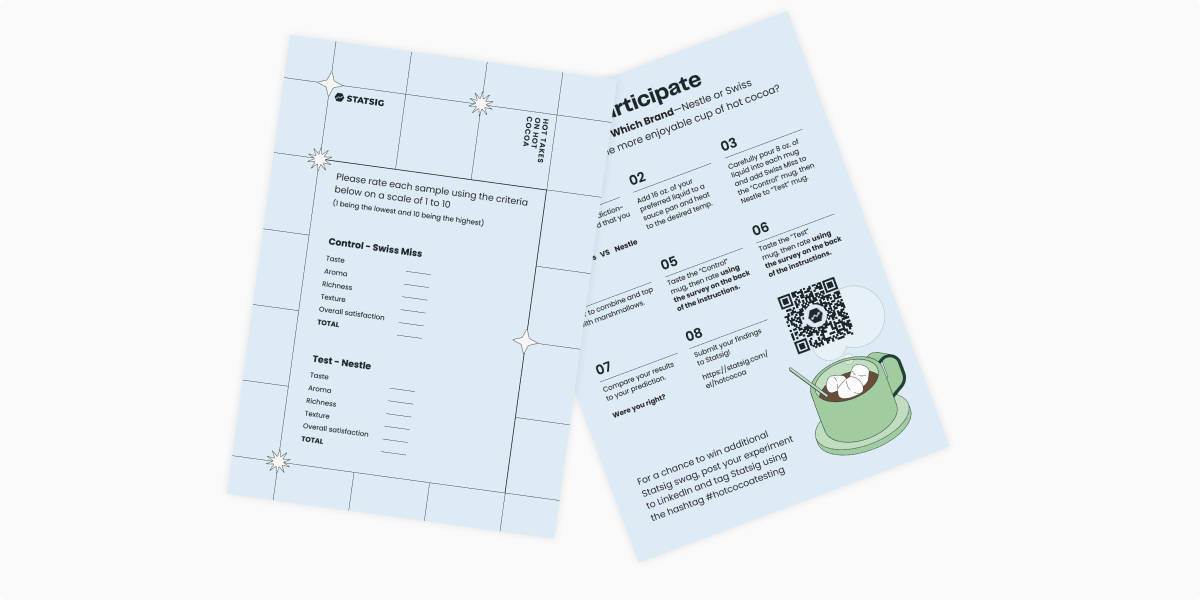
This experiment wasn't just about warming up with a delightful cup of hot cocoa; it was an opportunity to dive into the world of qualitative analysis and data science. We prepared gift packages containing custom mugs, two different brands of hot chocolate—Nestle and Swiss Miss, and a set of mini marshmallows.
Our goal? To determine which cocoa mix reigns supreme in the hearts and taste buds of our customers.
But, as most experimenters know already, the results are often unexpected, and this experiment was no different.
The execution
The journey of the "Hot Takes on Hot Chocolate" experiment began with a spark of creativity.
It was a collaborative effort where various teams—from marketing and design to product and data science—came together to brainstorm an engaging way to connect with our customers during the holiday season. The idea was to blend the warmth of the holiday spirit with the analytical aspect that is at the core of Statsig's culture.
After much deliberation and planning, the concept of a hot chocolate-tasting experiment was born.
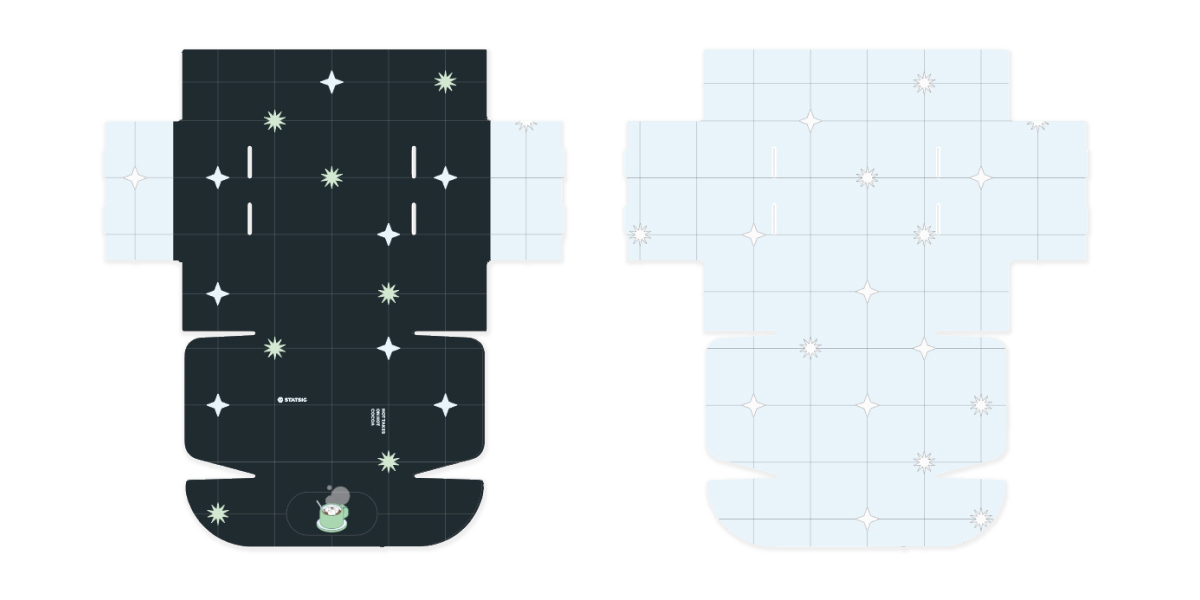
The teams got to work planning every detail, from the selection of the hot chocolate brands to the design of custom mugs and the development of a detailed instruction guide. The goal was to create not just a nice gift, but an experience that would resonate with our customers and bring a touch of Statsig's unique personality into their homes.
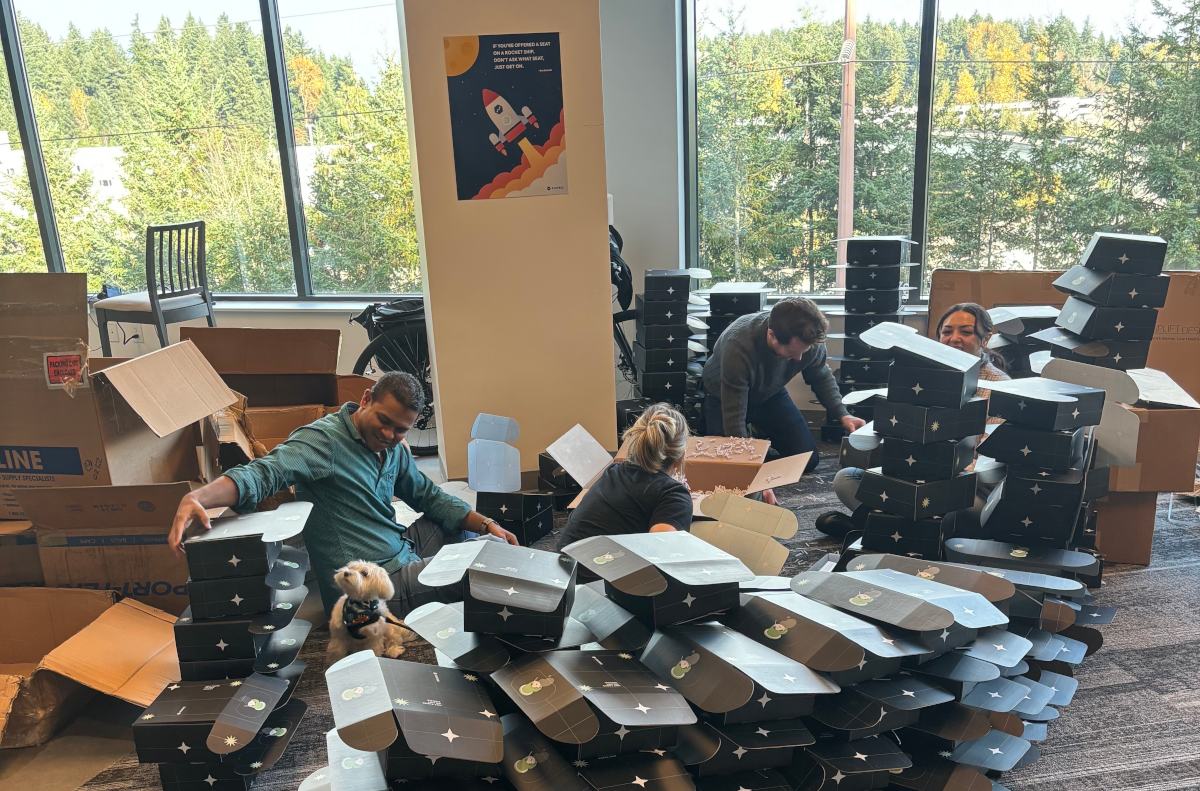
Once the design was finalized and the components were sourced, it was all hands on deck to assemble the packages. The excitement in the air was palpable as the boxes were carefully packed.
For three days, a large portion of our office became a box-packing operation, with roughly four employees working in assembly line fashion.
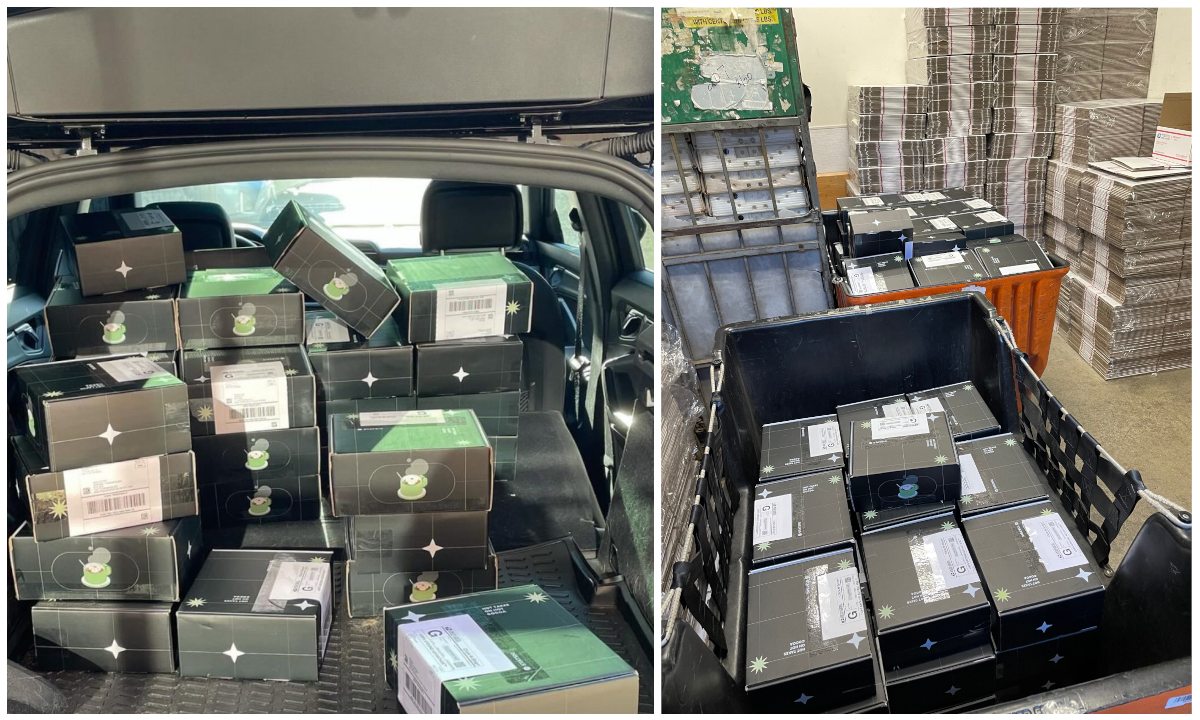
Finally, after days of hard work and anticipation, the packages were shipped, marking the beginning of a unique holiday adventure for our customers.
Get back to basics with A/B testing 101
The results
We wanted to learn which cocoa variety reigns supreme, but instead we learned a valuable lesson about shipping and end-to-end testing.
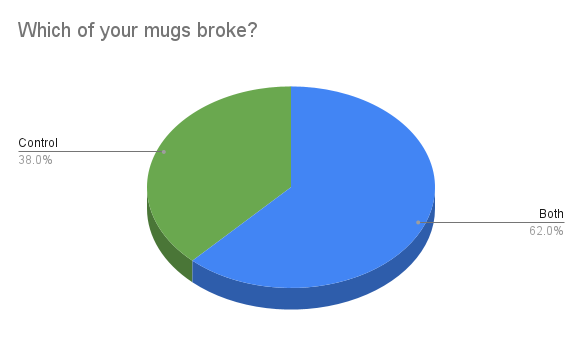
To our dismay, most of the mugs arrived broken. While the initial objective was to gather data on hot chocolate preferences, the true learnings revolved around logistics and packaging.
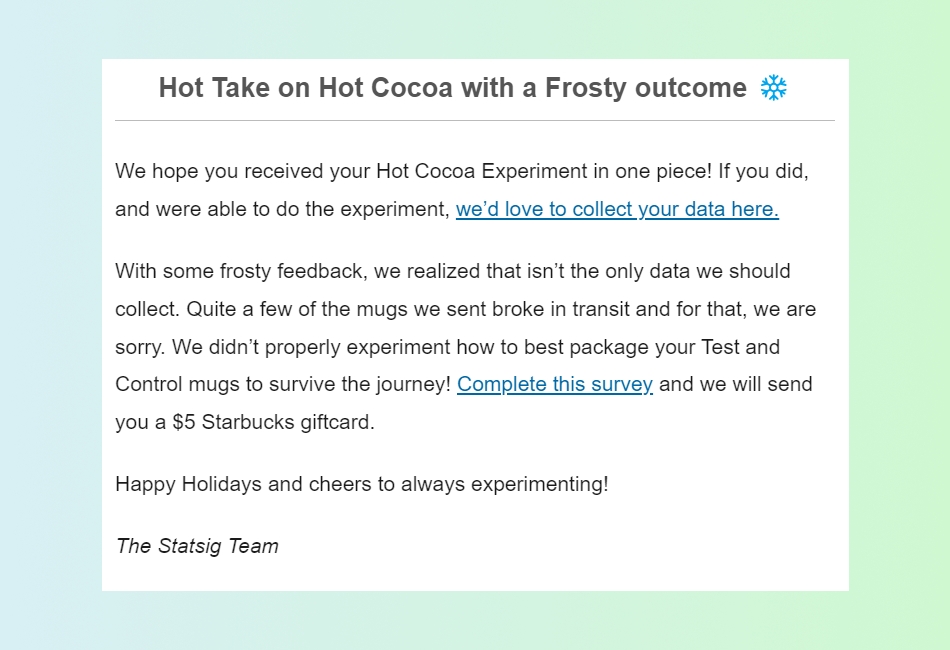
The team quickly sprang into action addressing customer concerns, which included sending out apology emails and Starbucks gift cards to those affected.
At least their Starbucks will come with a functioning vessel to drink from.
Despite the unforeseen (and unfortunate) outcome of this experiment, the sentiment still remains:
We’re genuinely grateful to our customers and friends for the trust and interest they’ve placed in Statsig, and we look forward to continuing our journey together in the coming year and beyond.
To all those who have been a part of our journey, thank you.
Get started now!
