Products
Solutions
Resources
Product Updates
Monitoring Metrics & Explore in Feature Gates, Multiple Metric Dimensions, and Improved Review UX!
Happy Friday, Statsig Community! We have a fun set of launch announcements for y'all this week.... making every last day count as we come up on the last few weeks of 2022!
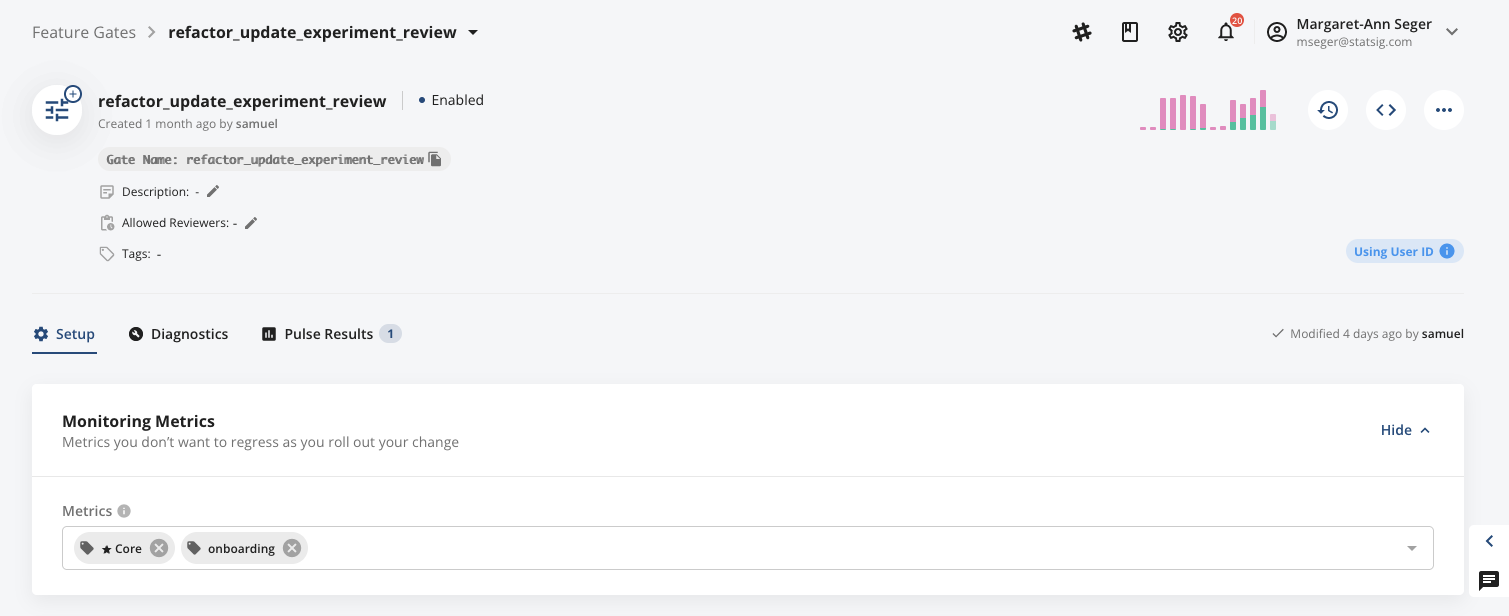
Monitoring Metrics & Explore in Feature Gates
Today, we’re excited to add an explicit section into Feature Gates for Monitoring Metrics. This will enable gate creators to call out any metrics they want to monitor as part of a feature rollout, and make it easier for non-creators to know what launch impact to look for.
Note that by default the Core tag will be auto-added to Monitoring Metrics for all new gate creations.
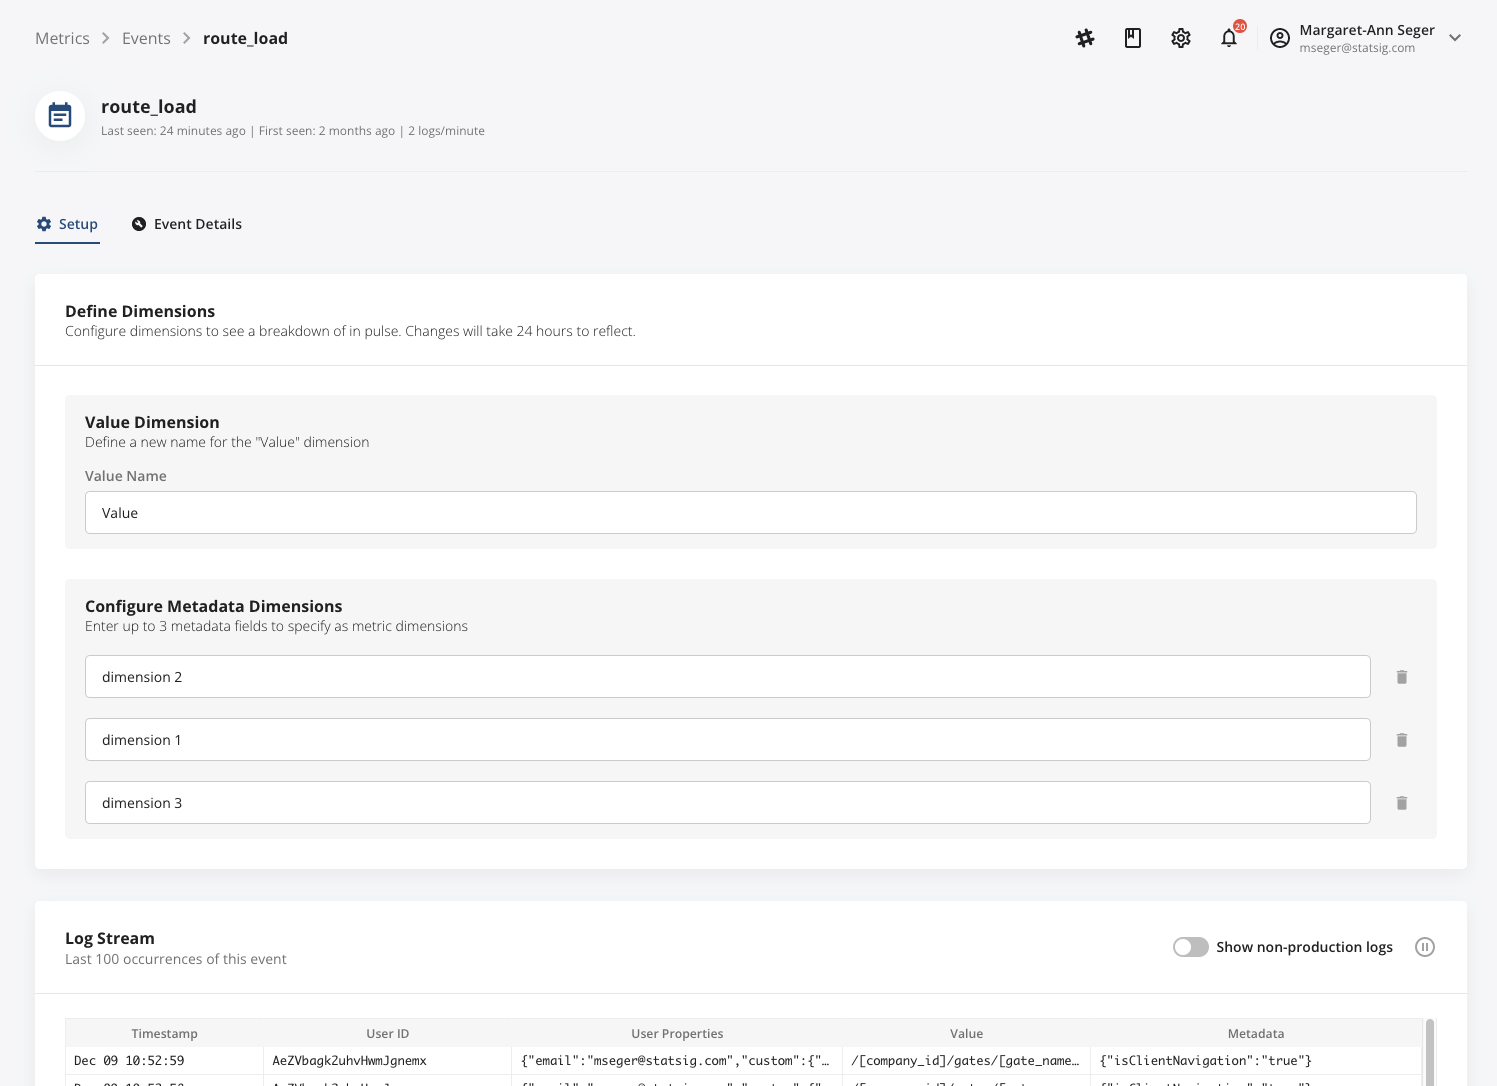
Up to 4 Multiple Metric Dimensions
Historically, we’ve supported sending in a Value and JSON metadata with every logged event, enabling you to break out Pulse results by a metric's Value inline within Pulse.
Today, we’re expanding the number of dimensions you can configure for an event, supporting up to 4 custom dimensions that you can define and send in with events to split your analysis by. To configure custom dimensions for your event, go to the Metrics tab → Events, select the event you want to configure and tap "Setup." Note that you cannot yet configure multiple dimensions for Custom Metrics.
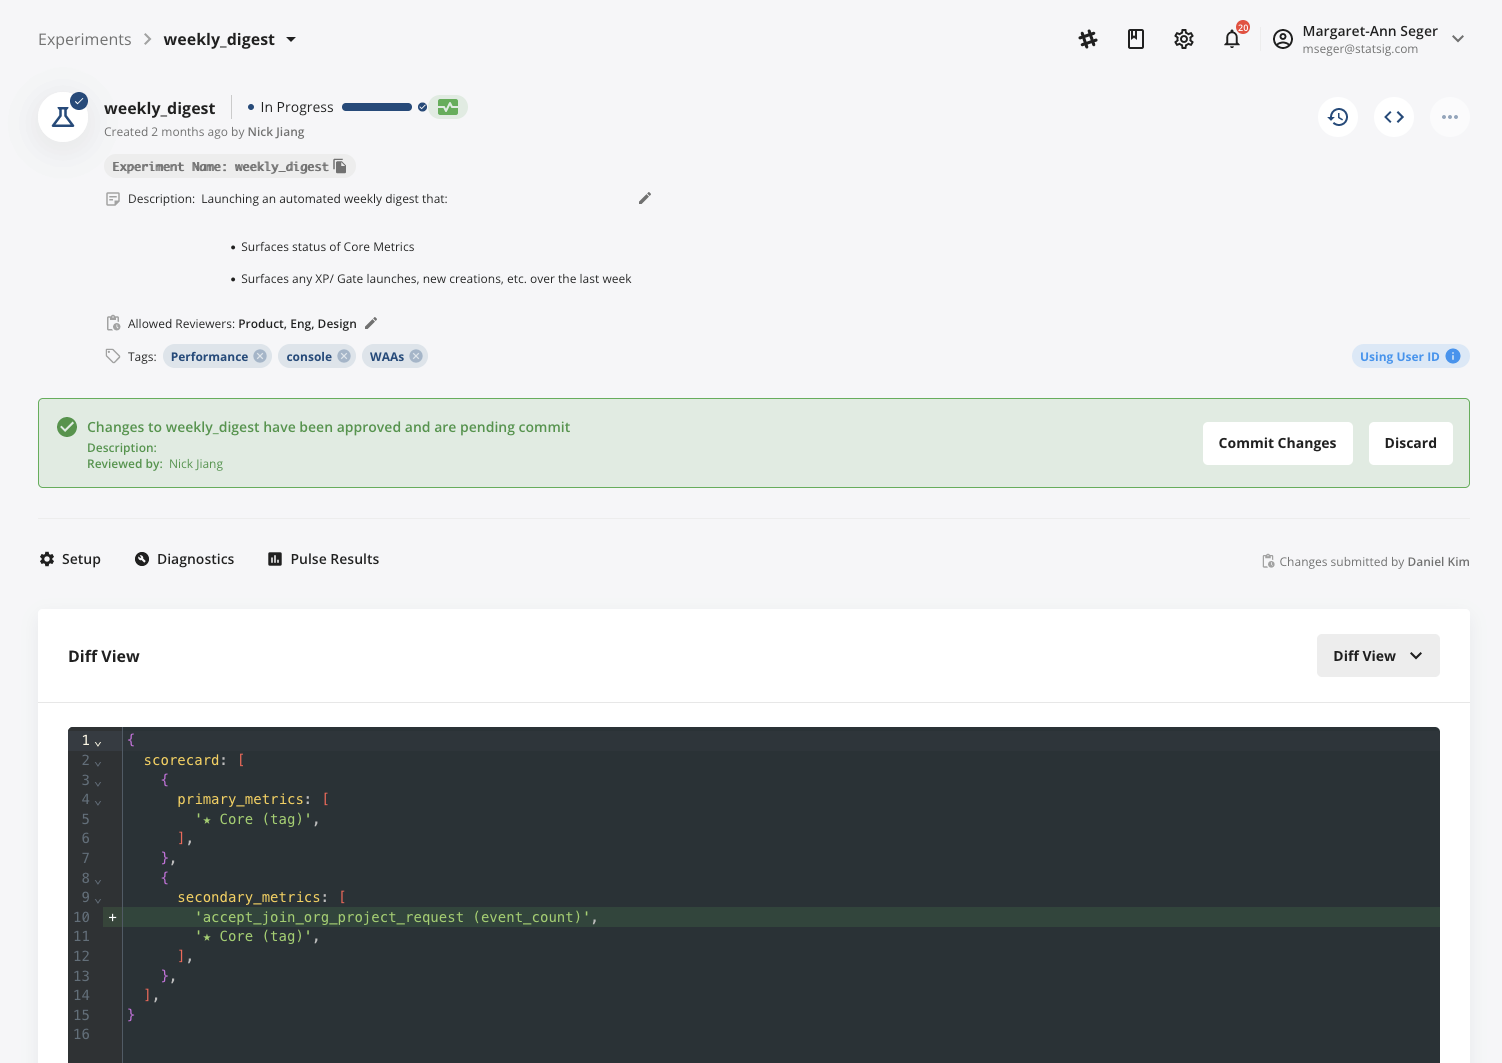
Improved Review UX
Reviewing gate and experiment changes is a core part of the rollout process. Today, we’re making reviews even easier by providing a clearer Before/ After experience to more easily view changes, as well as introducing a new review mode called “Diff View”.
To view changes in Diff View, simply toggle the mode selector in the upper right-hand corner of the review unit from “Visual View” to “Diff View”. Voila!
New Slack Integration
Hey everyone, we’ve just released a new integration for receiving console notifications on Slack.
This is different from the current Slack integration which just sends audit logs.
To enable, go to “Account Settings” -> “Notifications” tab.
For more information about the app, see https://statsigcommunity.slack.com/apps/A022AA315JN-statsig.
(FYI we are working to get the app approved on Slack’s app store, but this may take some time)
v1 Dashboards, Discussion Tags, and Advanced Search (Halloween Edition 🎃)
Happy Monday (and Happy Halloween) Statsig Community! We've got some tricks AND some treats up our sleeve for you today, with an exciting set of new product updates-
v1 Dashboards
You may have noticed a new “Dashboards” tab in the left-hand nav of your Console! Last week, we quietly started rolling out the v1 of our new Dashboards product. Dashboards give you a flexible canvas to build dashboards for the metrics, experiments, and rollouts your team cares most about.
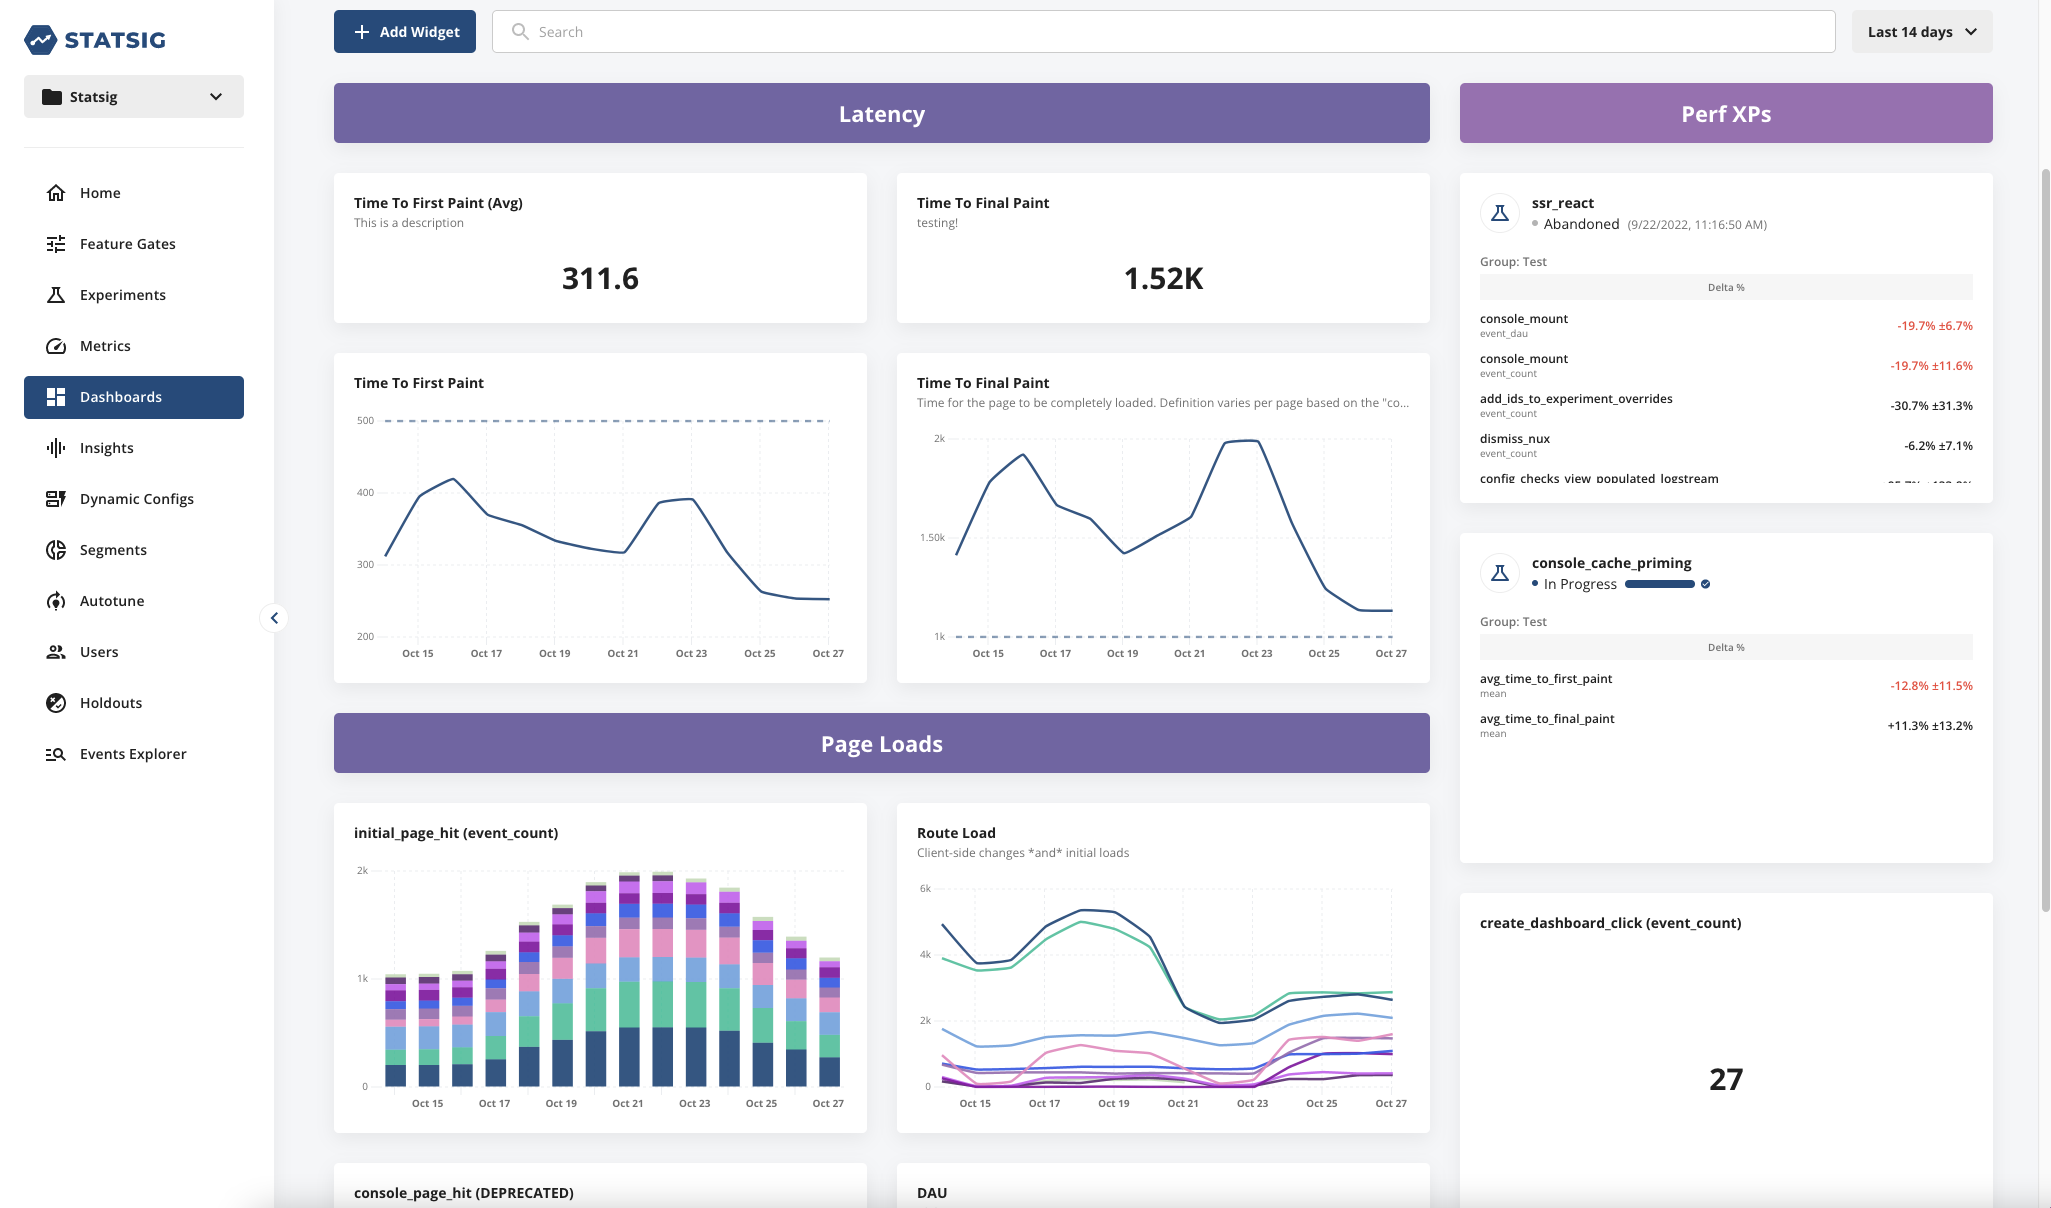
With Dashboards, you can-
Create Custom Time Series - Create line or bar charts of your metrics, including dimension breakdowns for events.
Add Experiment and Rollout Monitoring - Add any Experiments or feature roll-outs that may impact your metrics inline on your Dashboard.
Organize and Label Widgets - Quickly and easily organize your widgets on the drag-and-drop canvas of the Dashboard. Add labels to clearly delineate grouped metrics, as well as caption individual charts to clarify metric definitions.
This is an early v1 foundation for our newest product offering, and something that will continue to evolve. If you have any feedback, we would love to hear it! Don’t hesitate to reach out with feature requests or suggestions for improvements.
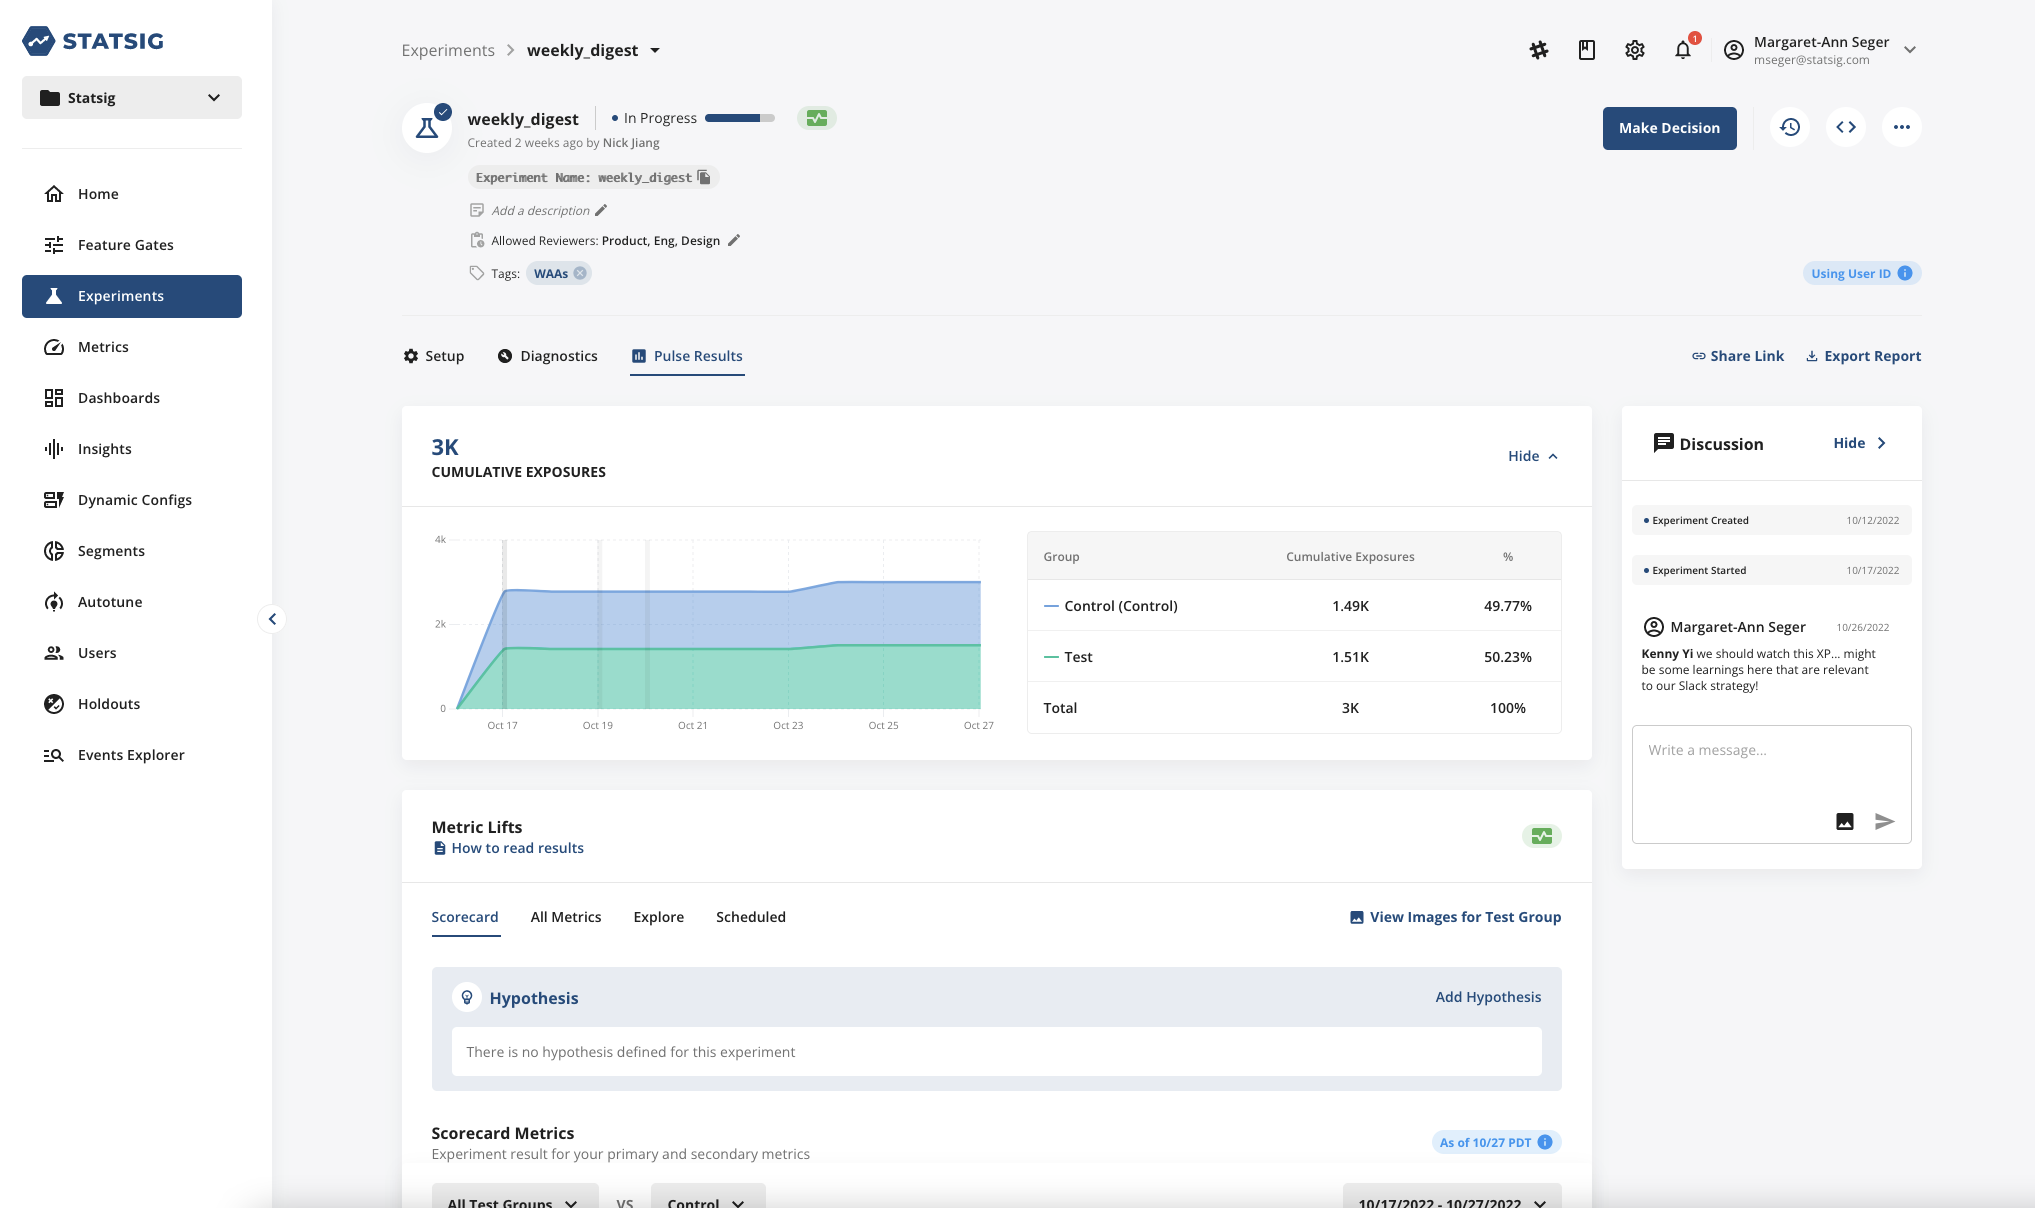
Discussion Tags
To make adding relevant folks into the conversation on your Experiments and Gates easier, we’ve added the ability to tag team members in Discussions. Tagging team members in a Discussion comment will notify them via email (and soon Slack as well!)
Advanced Search Capabilities
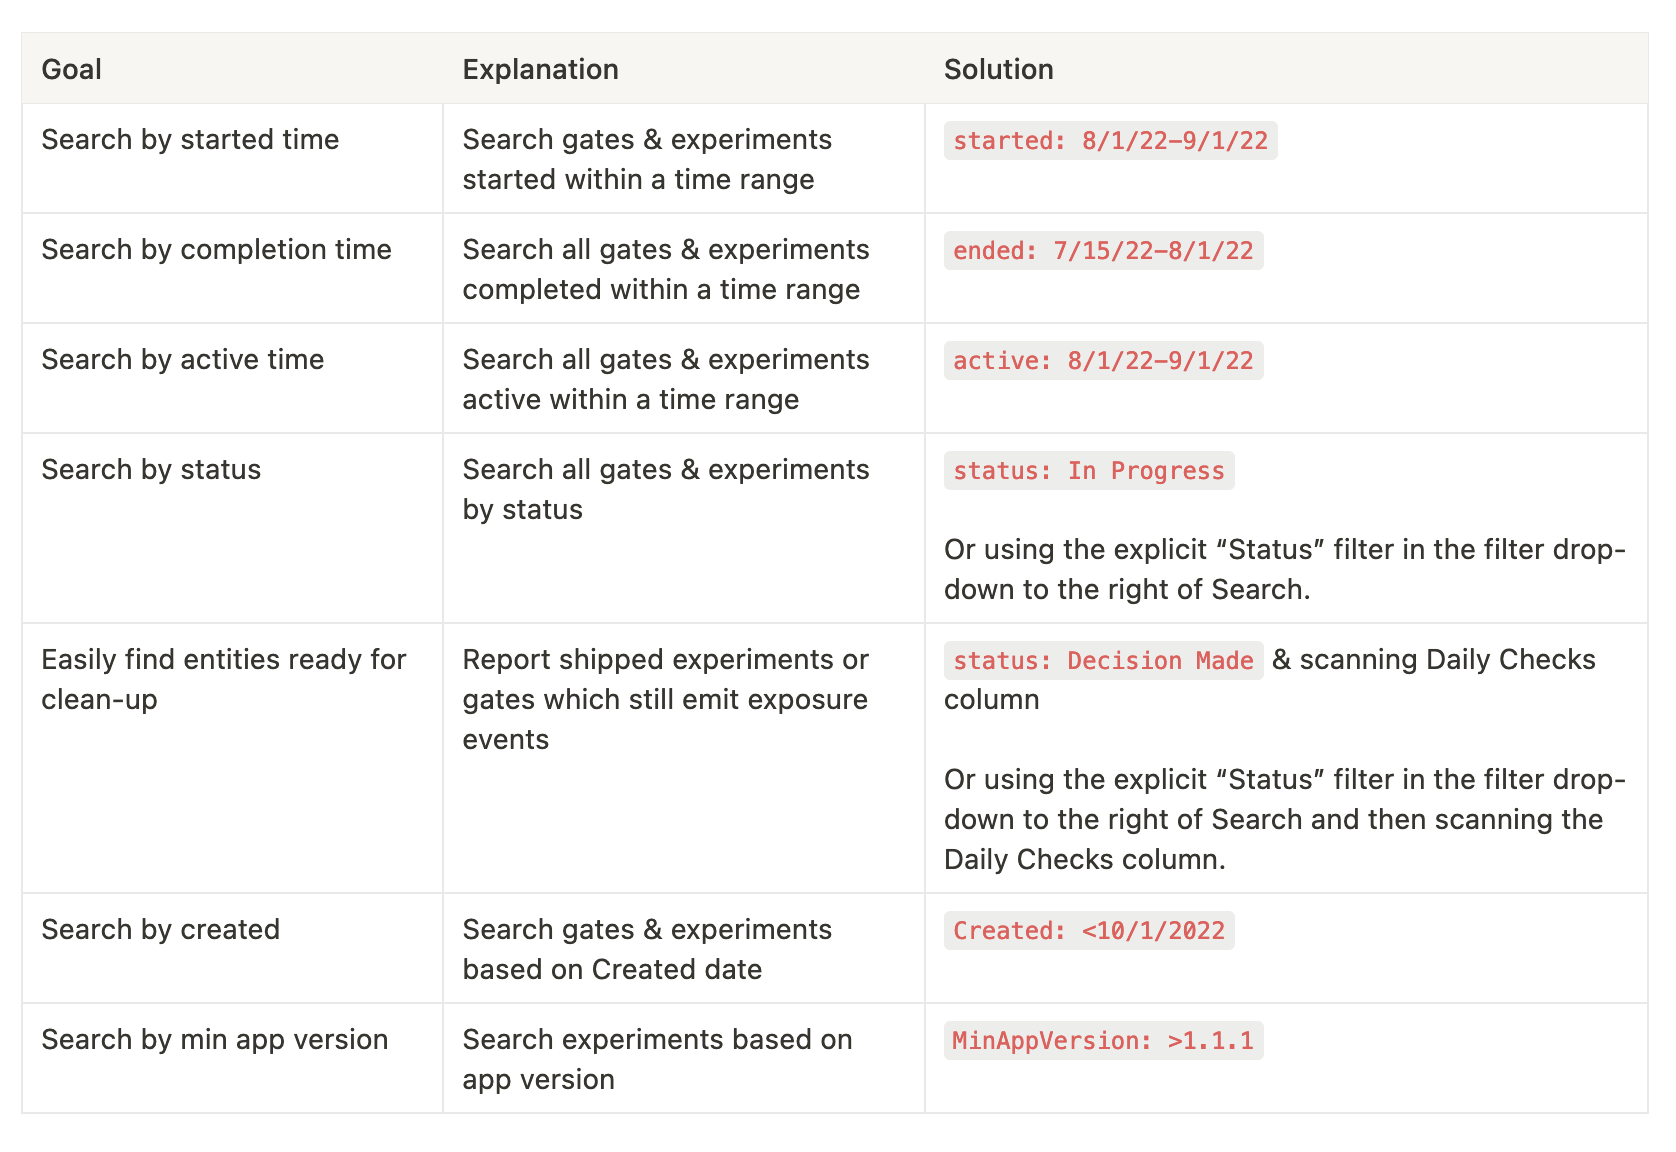
Powerful search capabilities are key to being able to quickly navigate the Statsig Console. Today, we’re excited to announce that we’ve added keyword search for “started”, “ended”, and “active” search keywords, with support for either one date or a date range.
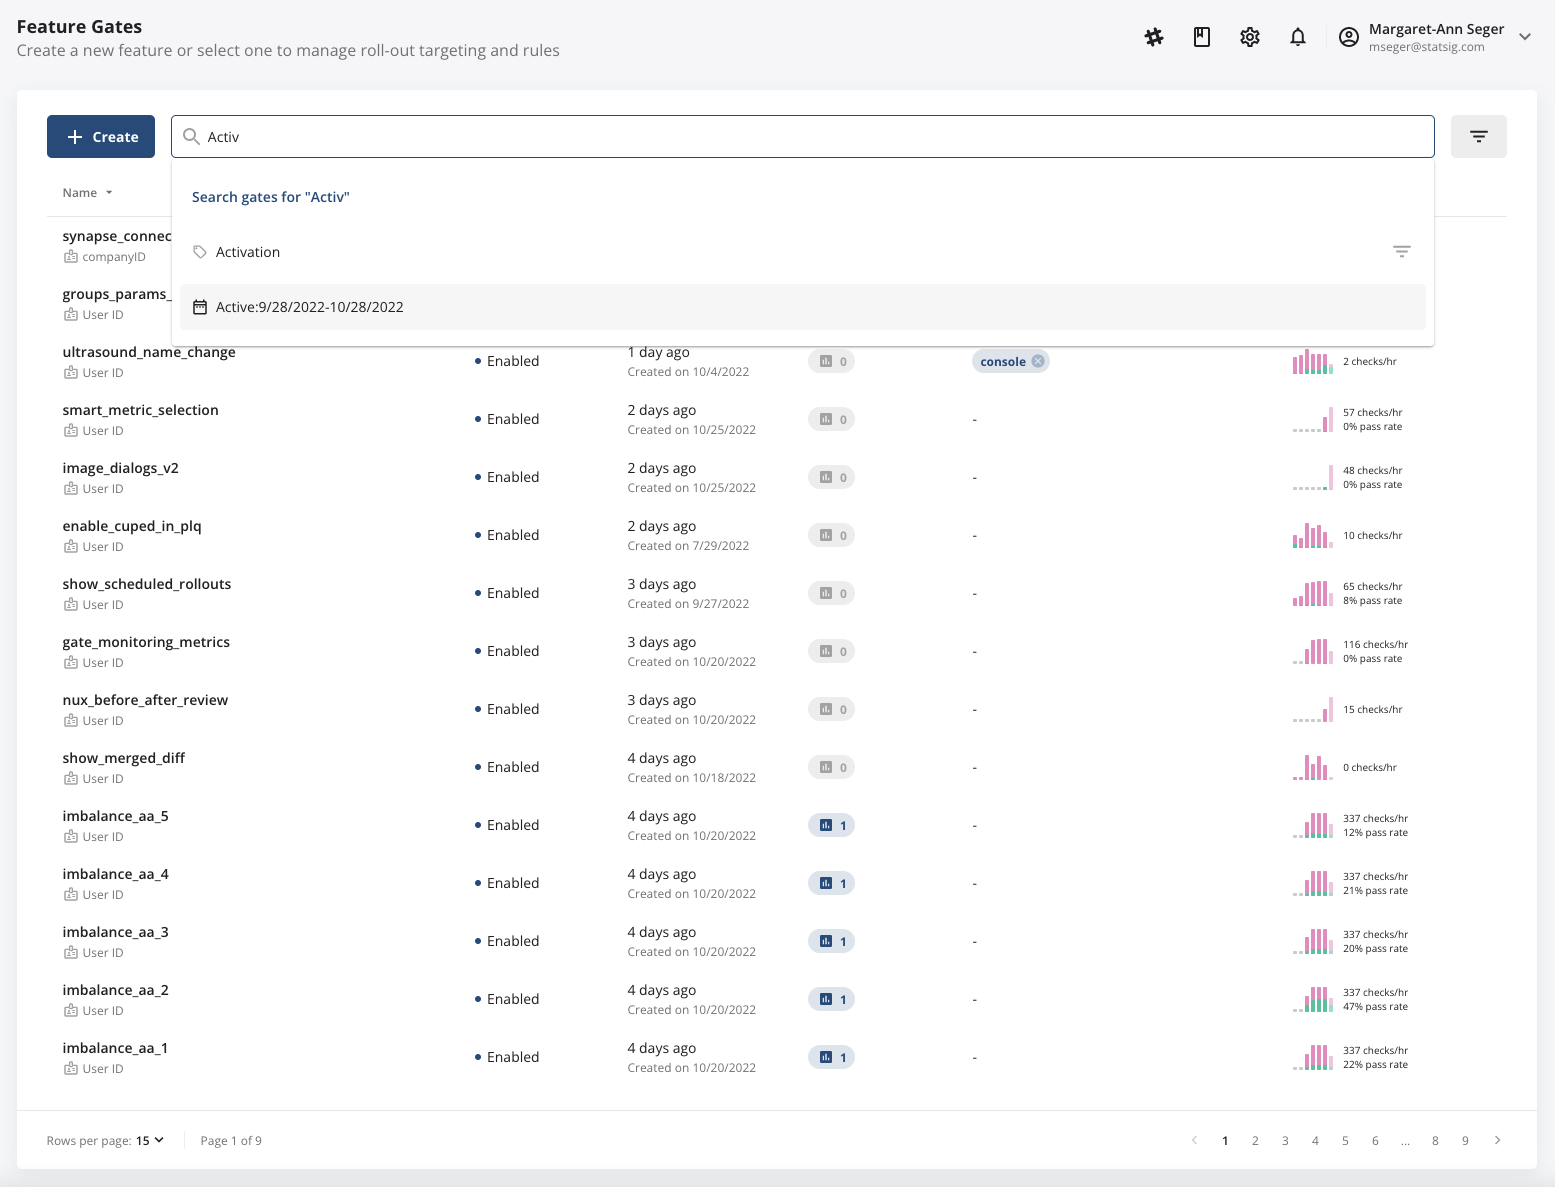
Attached is a table of how to use these. We've also added explicit filter options next to the search bar that will enable you to filter by Status, Health Check Status, ID Type, Creator, & Tag (all of which are also supported directly inline in Search).
Deeper Amplitude Integration
New Integration: Incoming Events From Amplitude
Hey all, just wanted to announce that we have completed work on the Amplitude incoming integration. This will allow you to configure Amplitude to forward events to Statsig.
Statsig Docs: https://docs.statsig.com/integrations/data-connectors/amplitude
Amplitude Docs: https://www.docs.developers.amplitude.com/data/destinations/statsig/
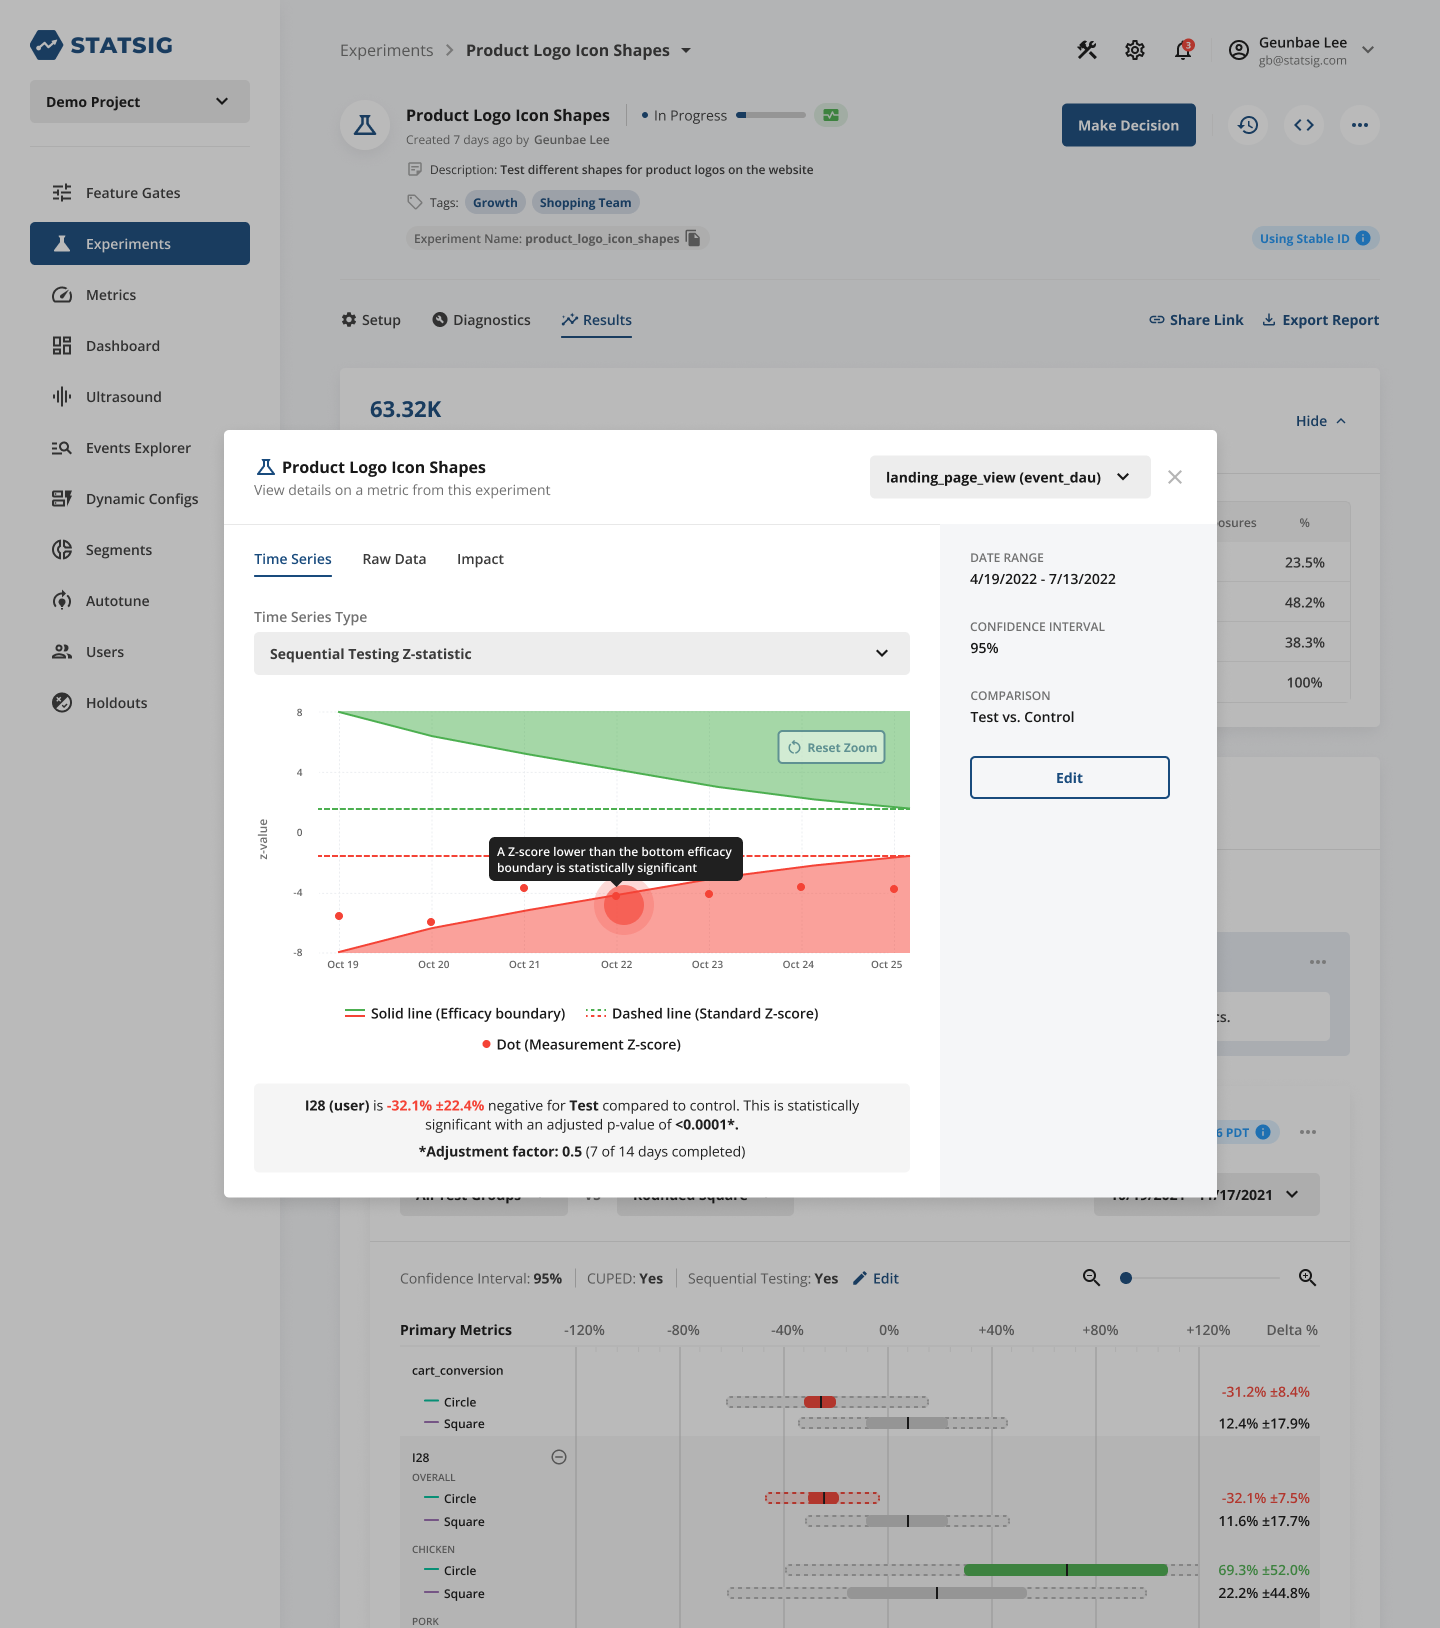
New Sequential Testing Capabilities
Sequential Testing
Today, we’re continuing to invest in our Stats Engine with the addition of Sequential Testing capabilities. In Sequential Testing, the p-values for each preliminary analysis window are adjusted to compensate for the increased false positive rate associated with peeking. The goal is to enable early decision-making when there's sufficient evidence, while limiting the risk of false positives.
To enable Sequential Testing on your experiment, we require setting a target duration (which is used to calculate the adjusted p-values). We provide a handy Power Analysis Calculator within Experiment Setup to enable quick and easy estimation of target duration.
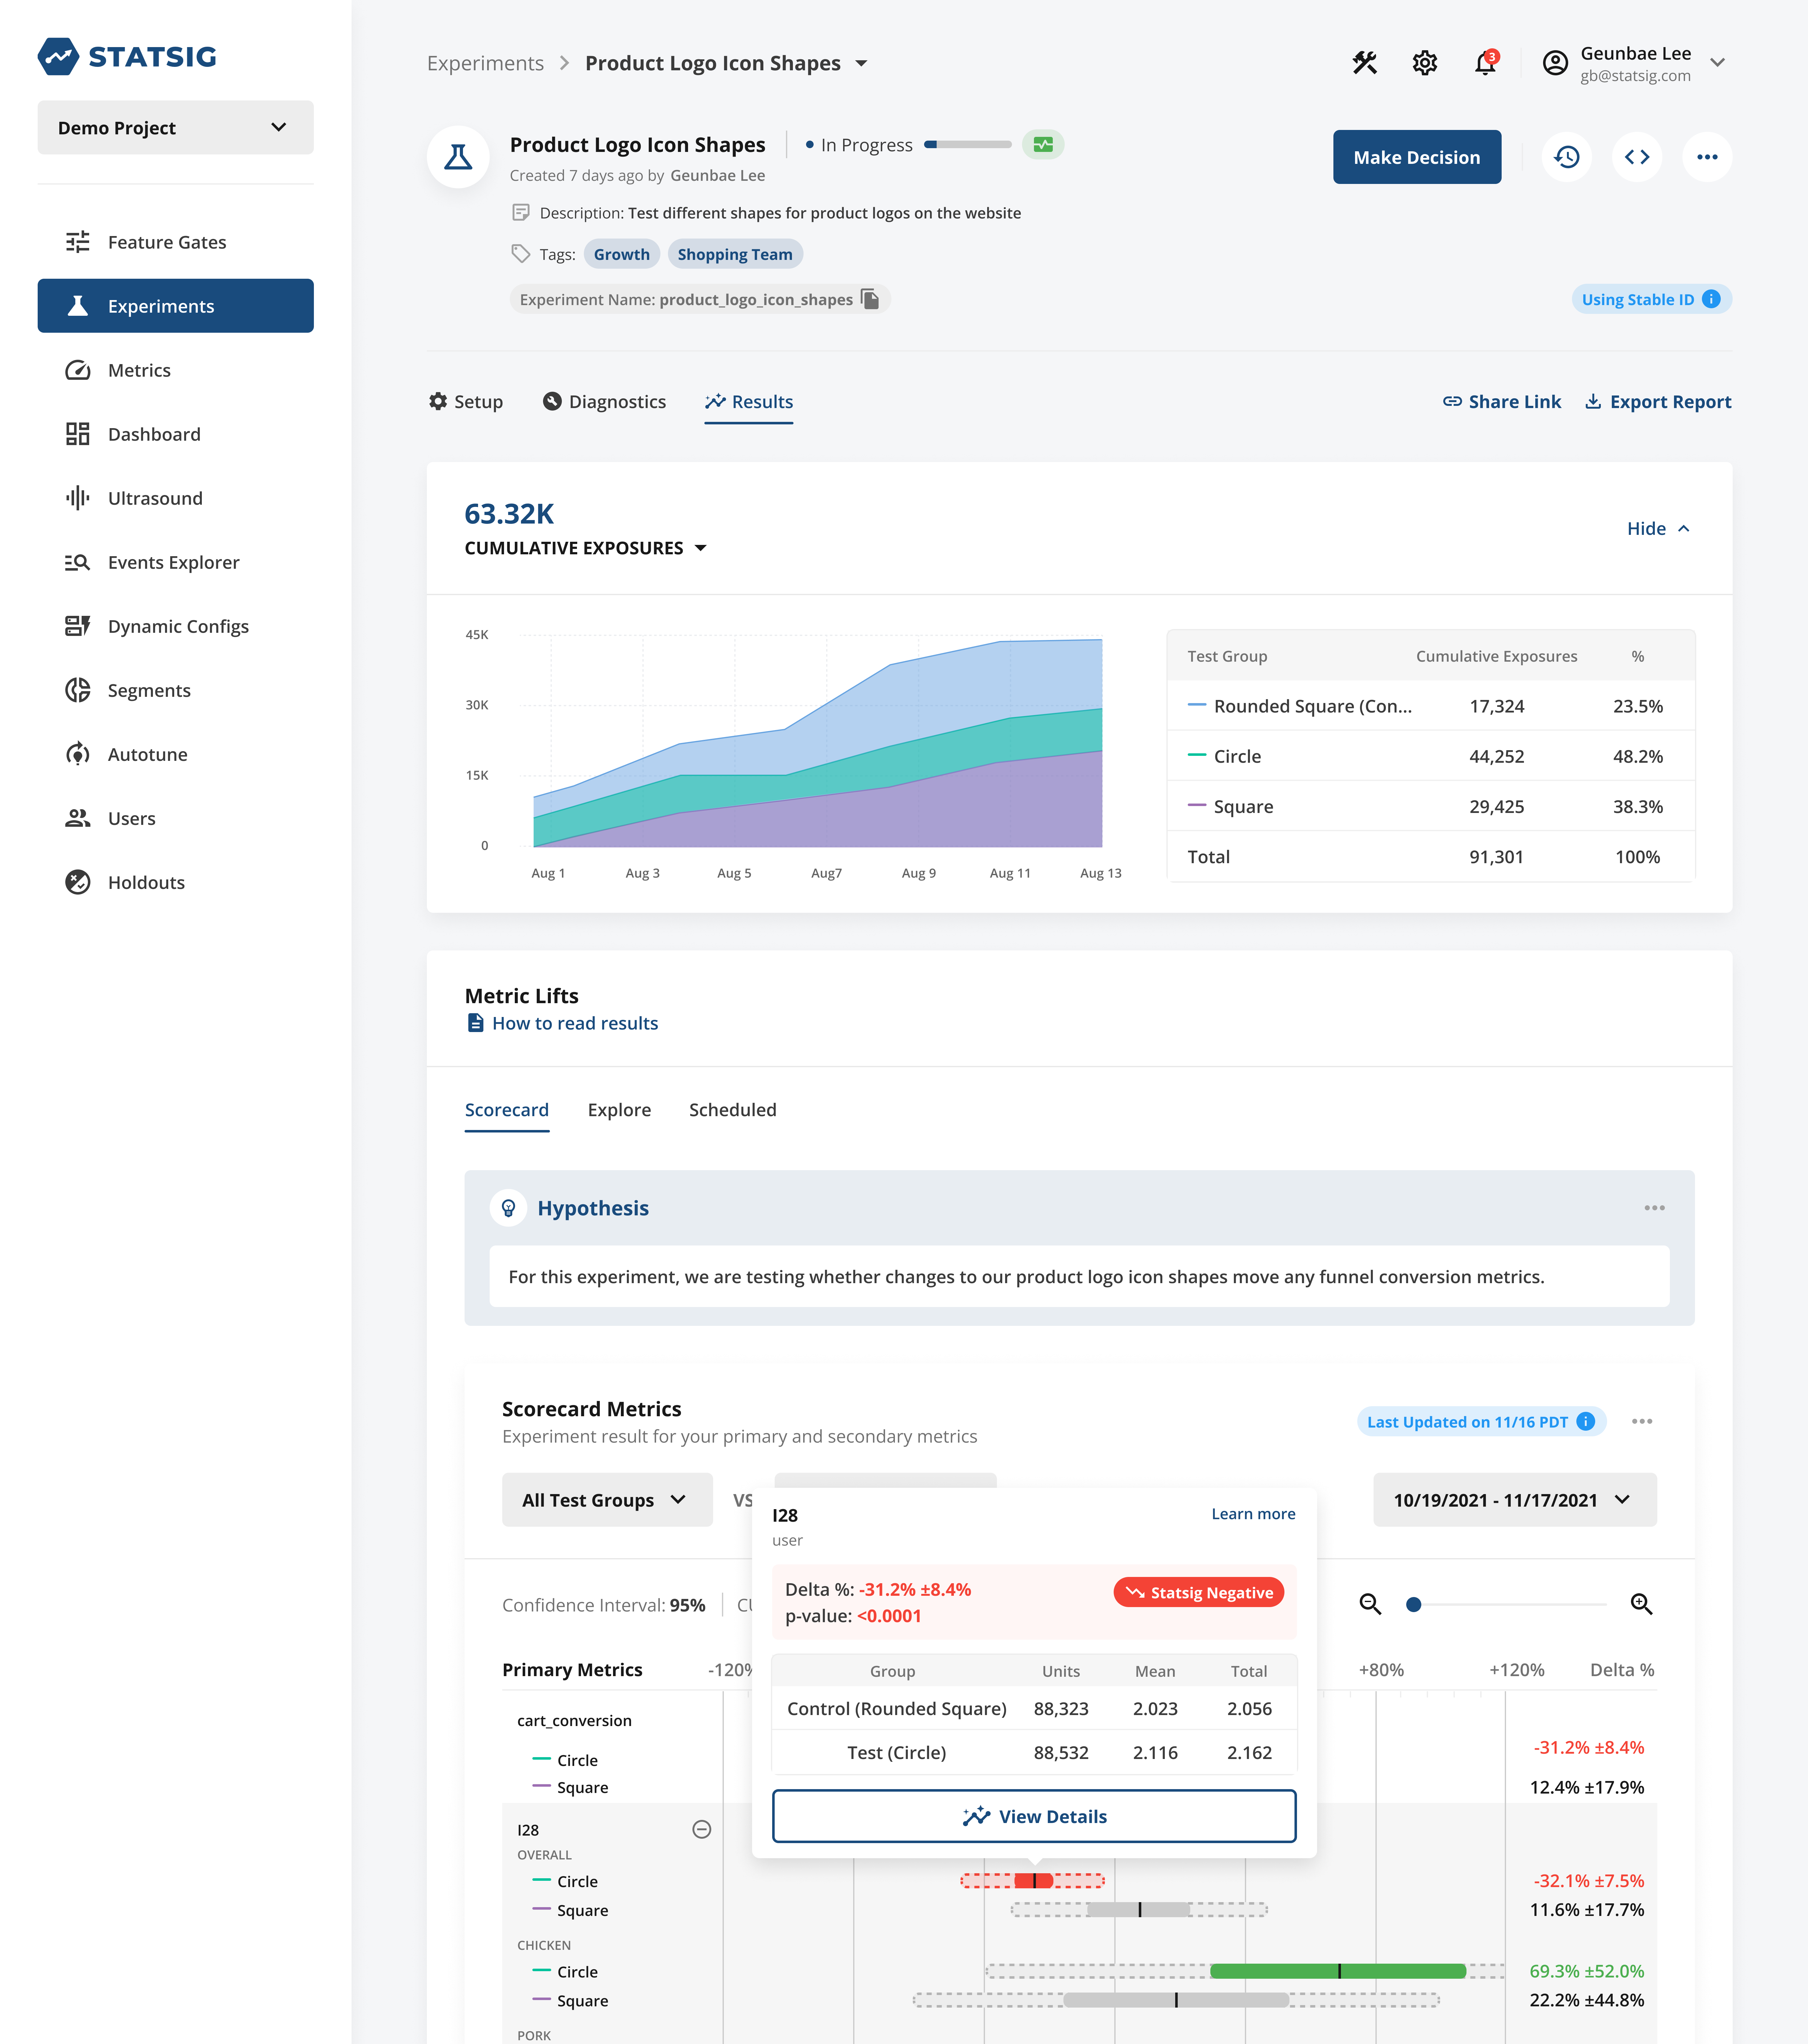
Once a target duration is set, simply toggle on Sequential Testing to start seeing adjusted confidence intervals overlayed over the default 95% confidence interval within your Pulse results.
Experiment Setup Configuration UX, Automated A/A Test Reports, and more!
Happy FRIDAY, Statsig Community! We've made it to the end of the week, which means it's time for another set of product launch announcements!
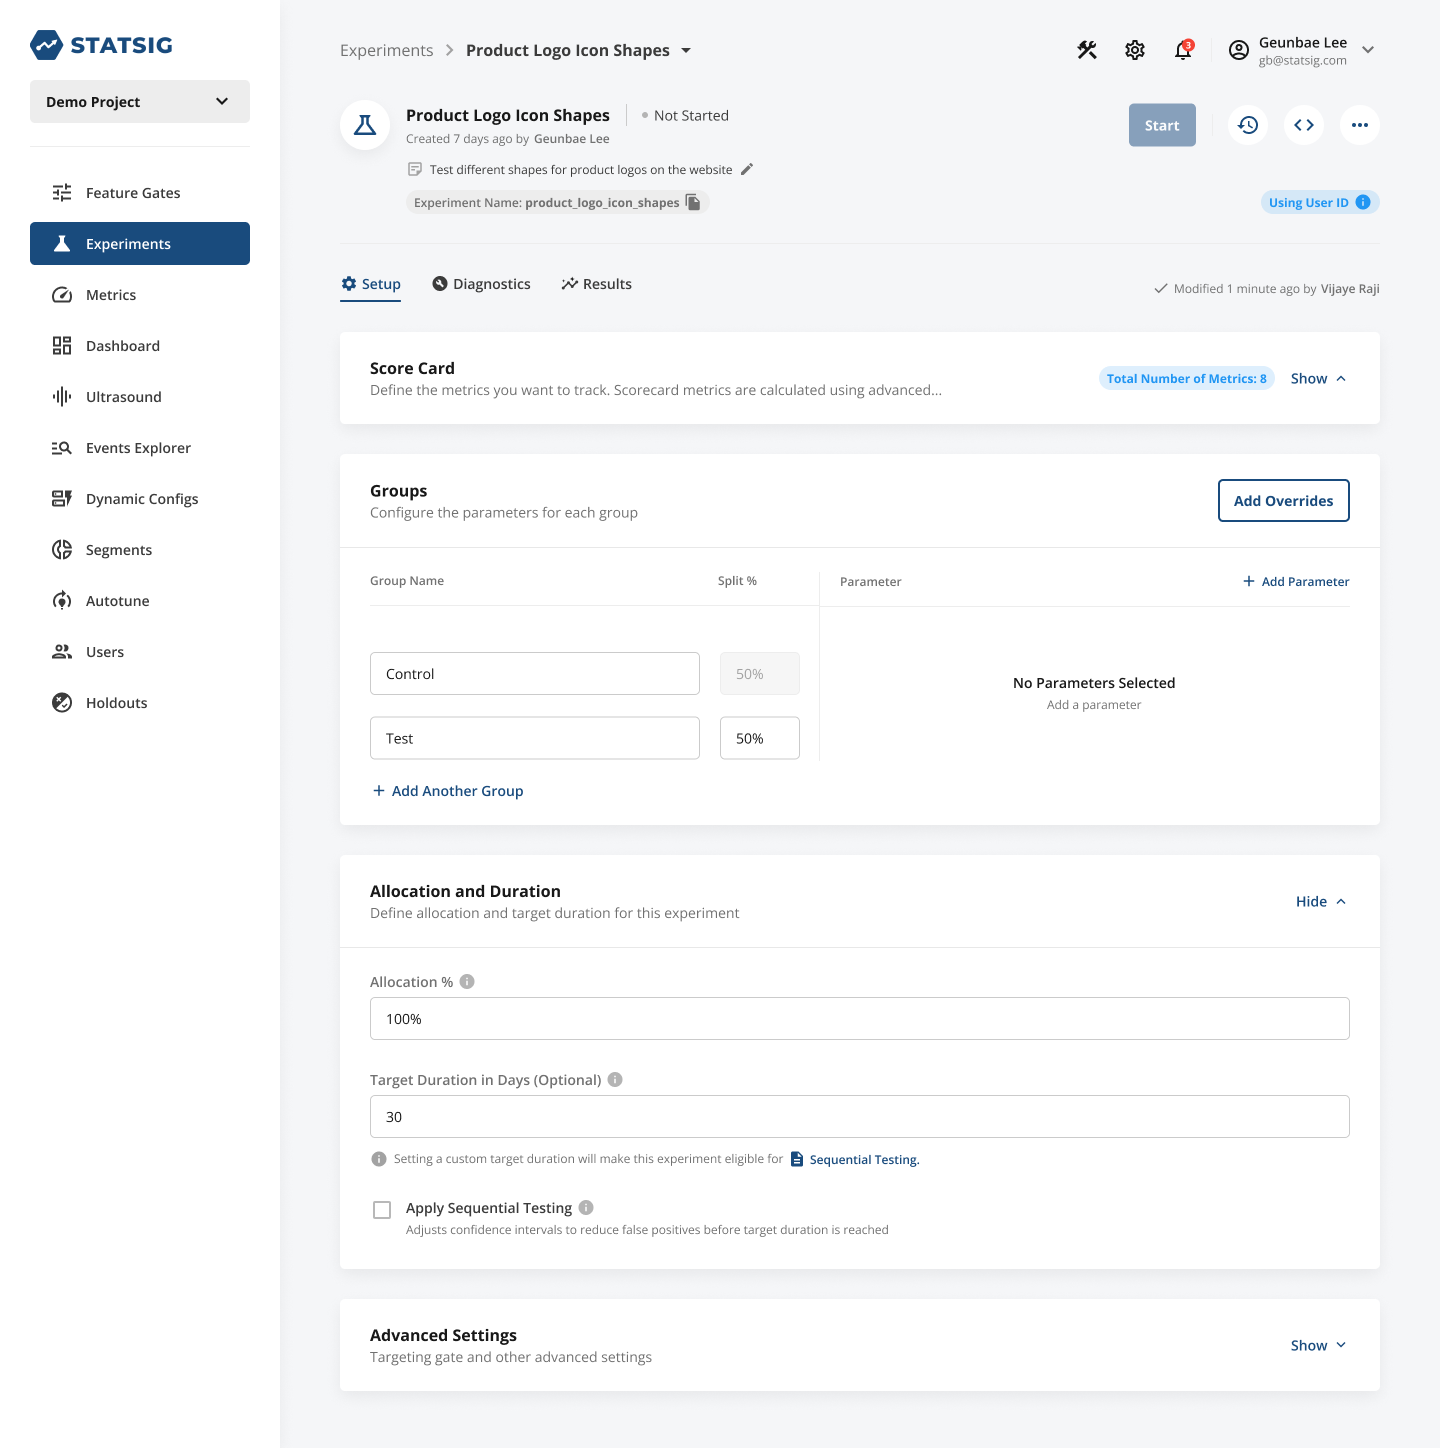
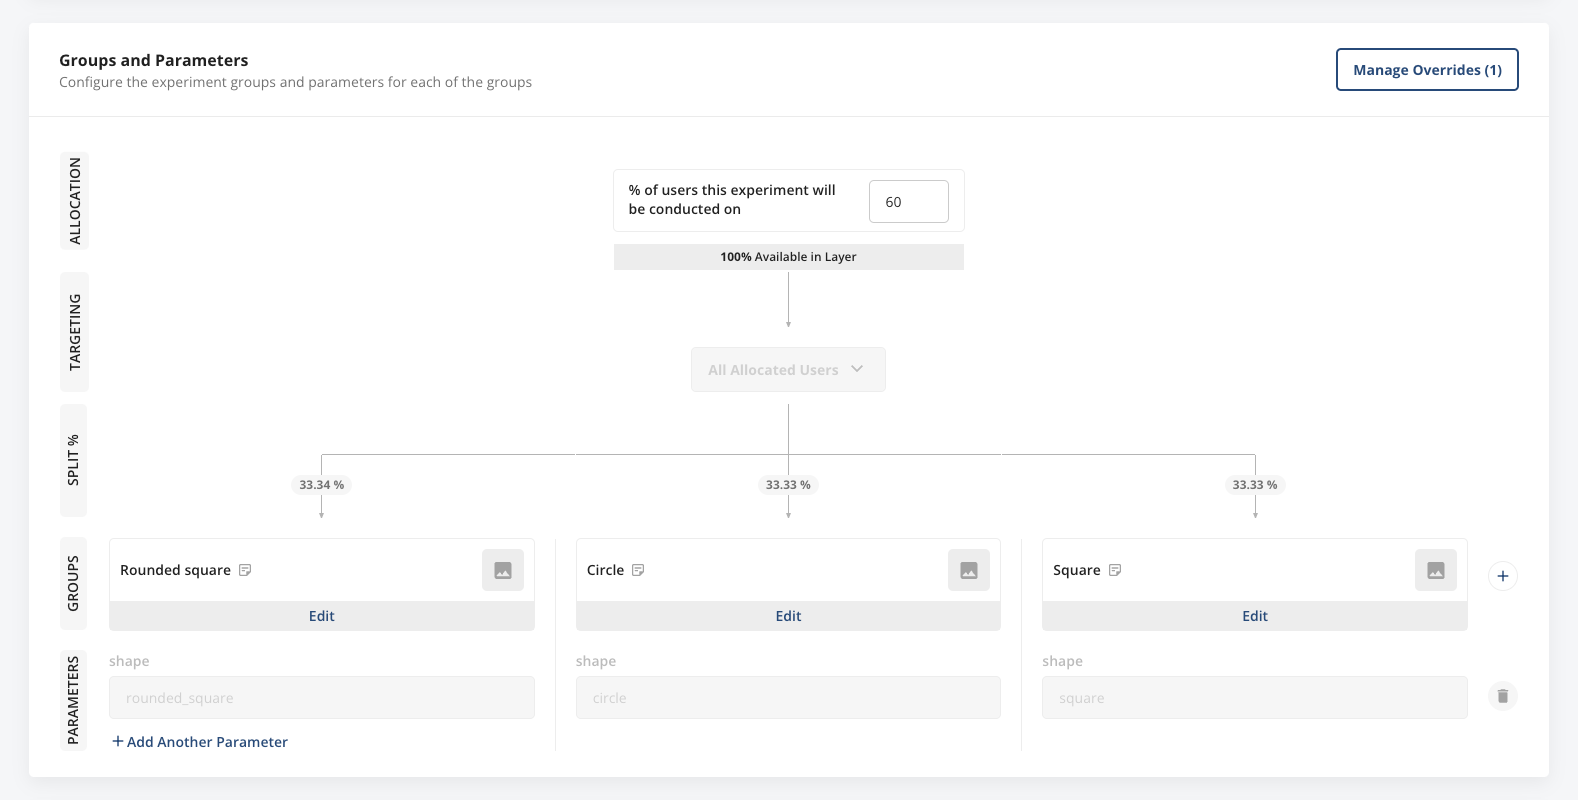
New Experiment Setup Configuration UX
Today, we’re excited to debut a sleek new configuration UX for experiment groups and parameters. Easily see your layer allocation, any targeting gates you’re using, experiment parameters, groups, and group split percentages in one, clear visual breakdown.
We believe this will make setting up experiments more intuitive for members of your team who are newer to Statsig, as well as give experiment creators and viewers alike an intuitive overview of how the experiment is configured.
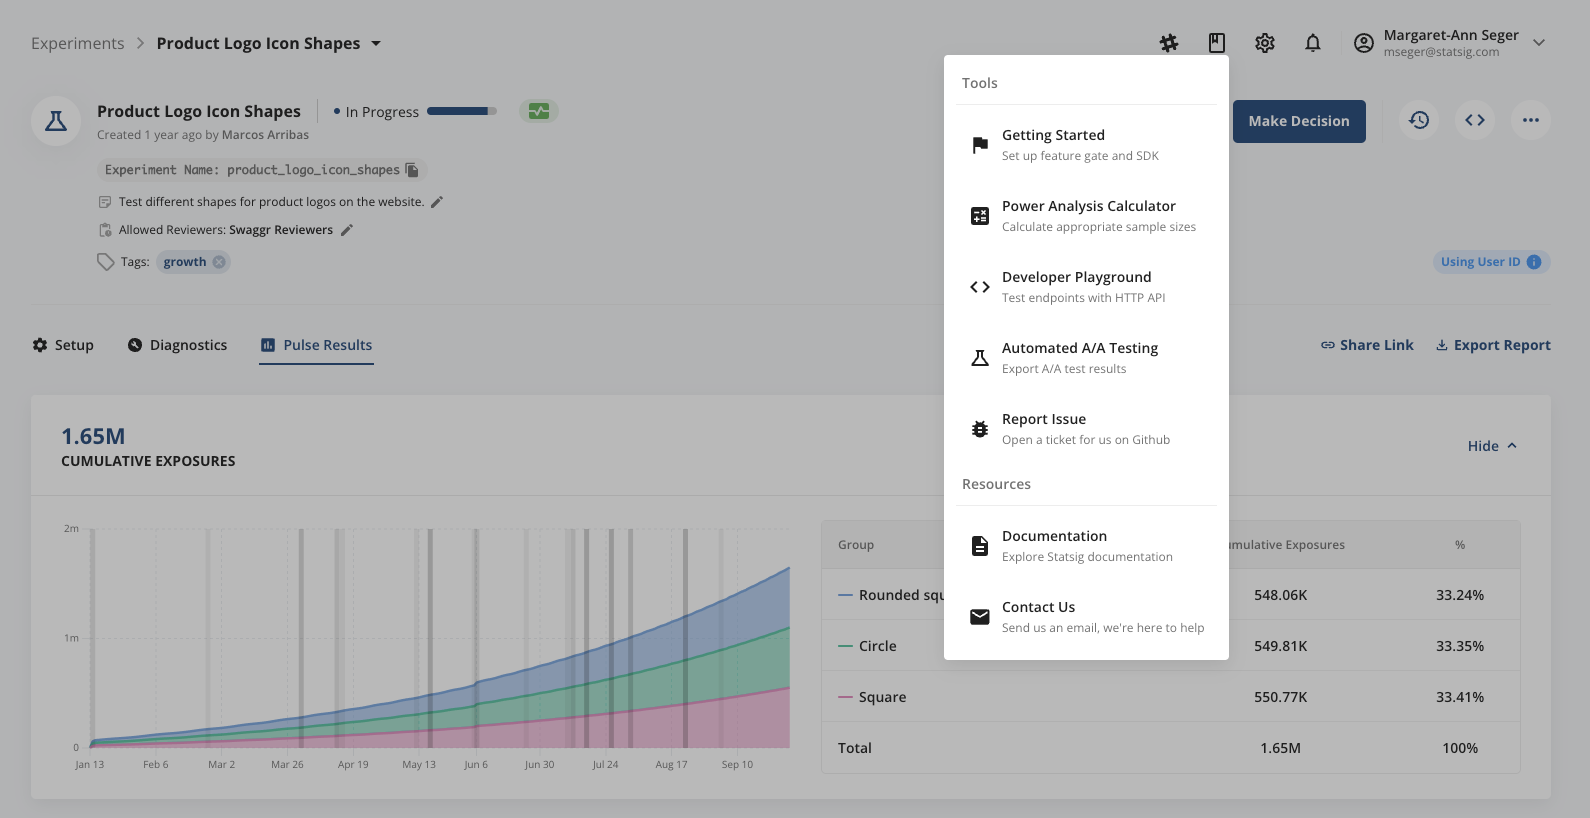
Automated A/A Test Reports
It’s oftentimes considered best practice to regularly ensure the health of your stats engine and your metrics by running periodic A/A tests. We’ve made running these A/A tests at scale easy by setting up simulated A/A tests that run every day in the background, for every company on the platform. Starting today, you can download the running history of your simulated A/A test performance via the “Tools” menu in your Statsig Console.
We run 10 tests/ day, and the download will include your last 30 days of test results. Please note that we only started running these simulations ~1 week ago, so a download today will only include ~70 sets of simulation results.
Broader ID Support in Autotune and Downloadable Events Explorer Results
Happy Friday, Statsig Community! Ending the week on a high note with a few new product launches for y'all-
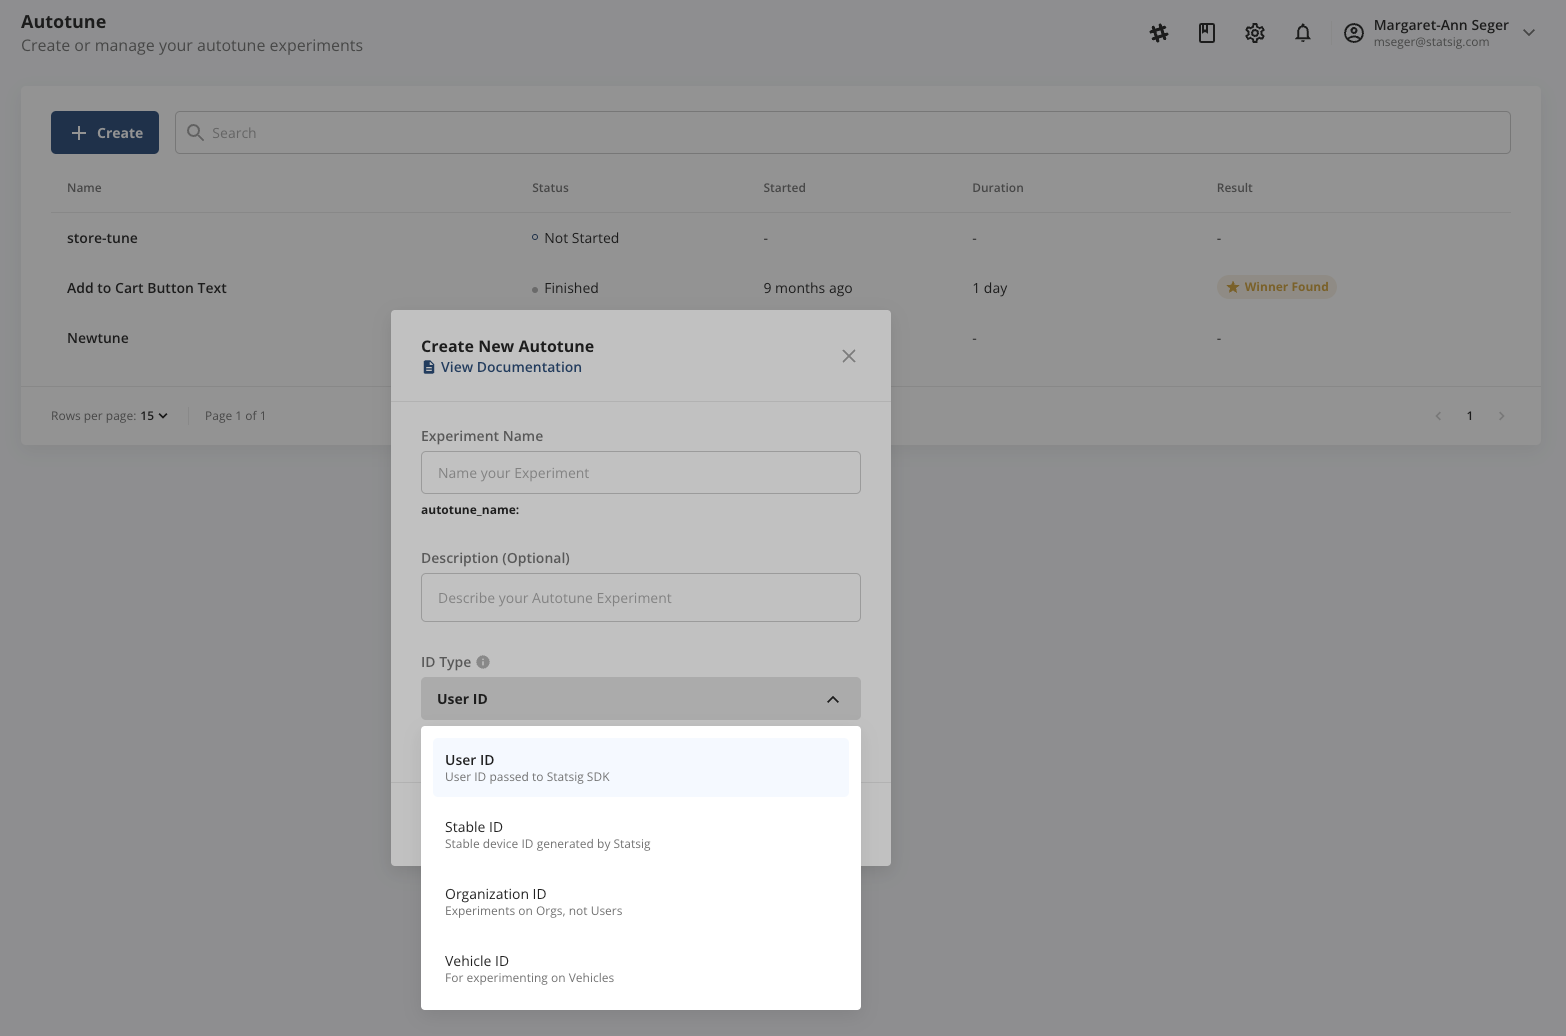
Broader ID Support in Autotune
This past week we added support for Stable & Custom IDs into Autotune, broadening the scope of use-cases you can run an Autotune experiment on. To learn more about leveraging Autotune, check out our docs here.
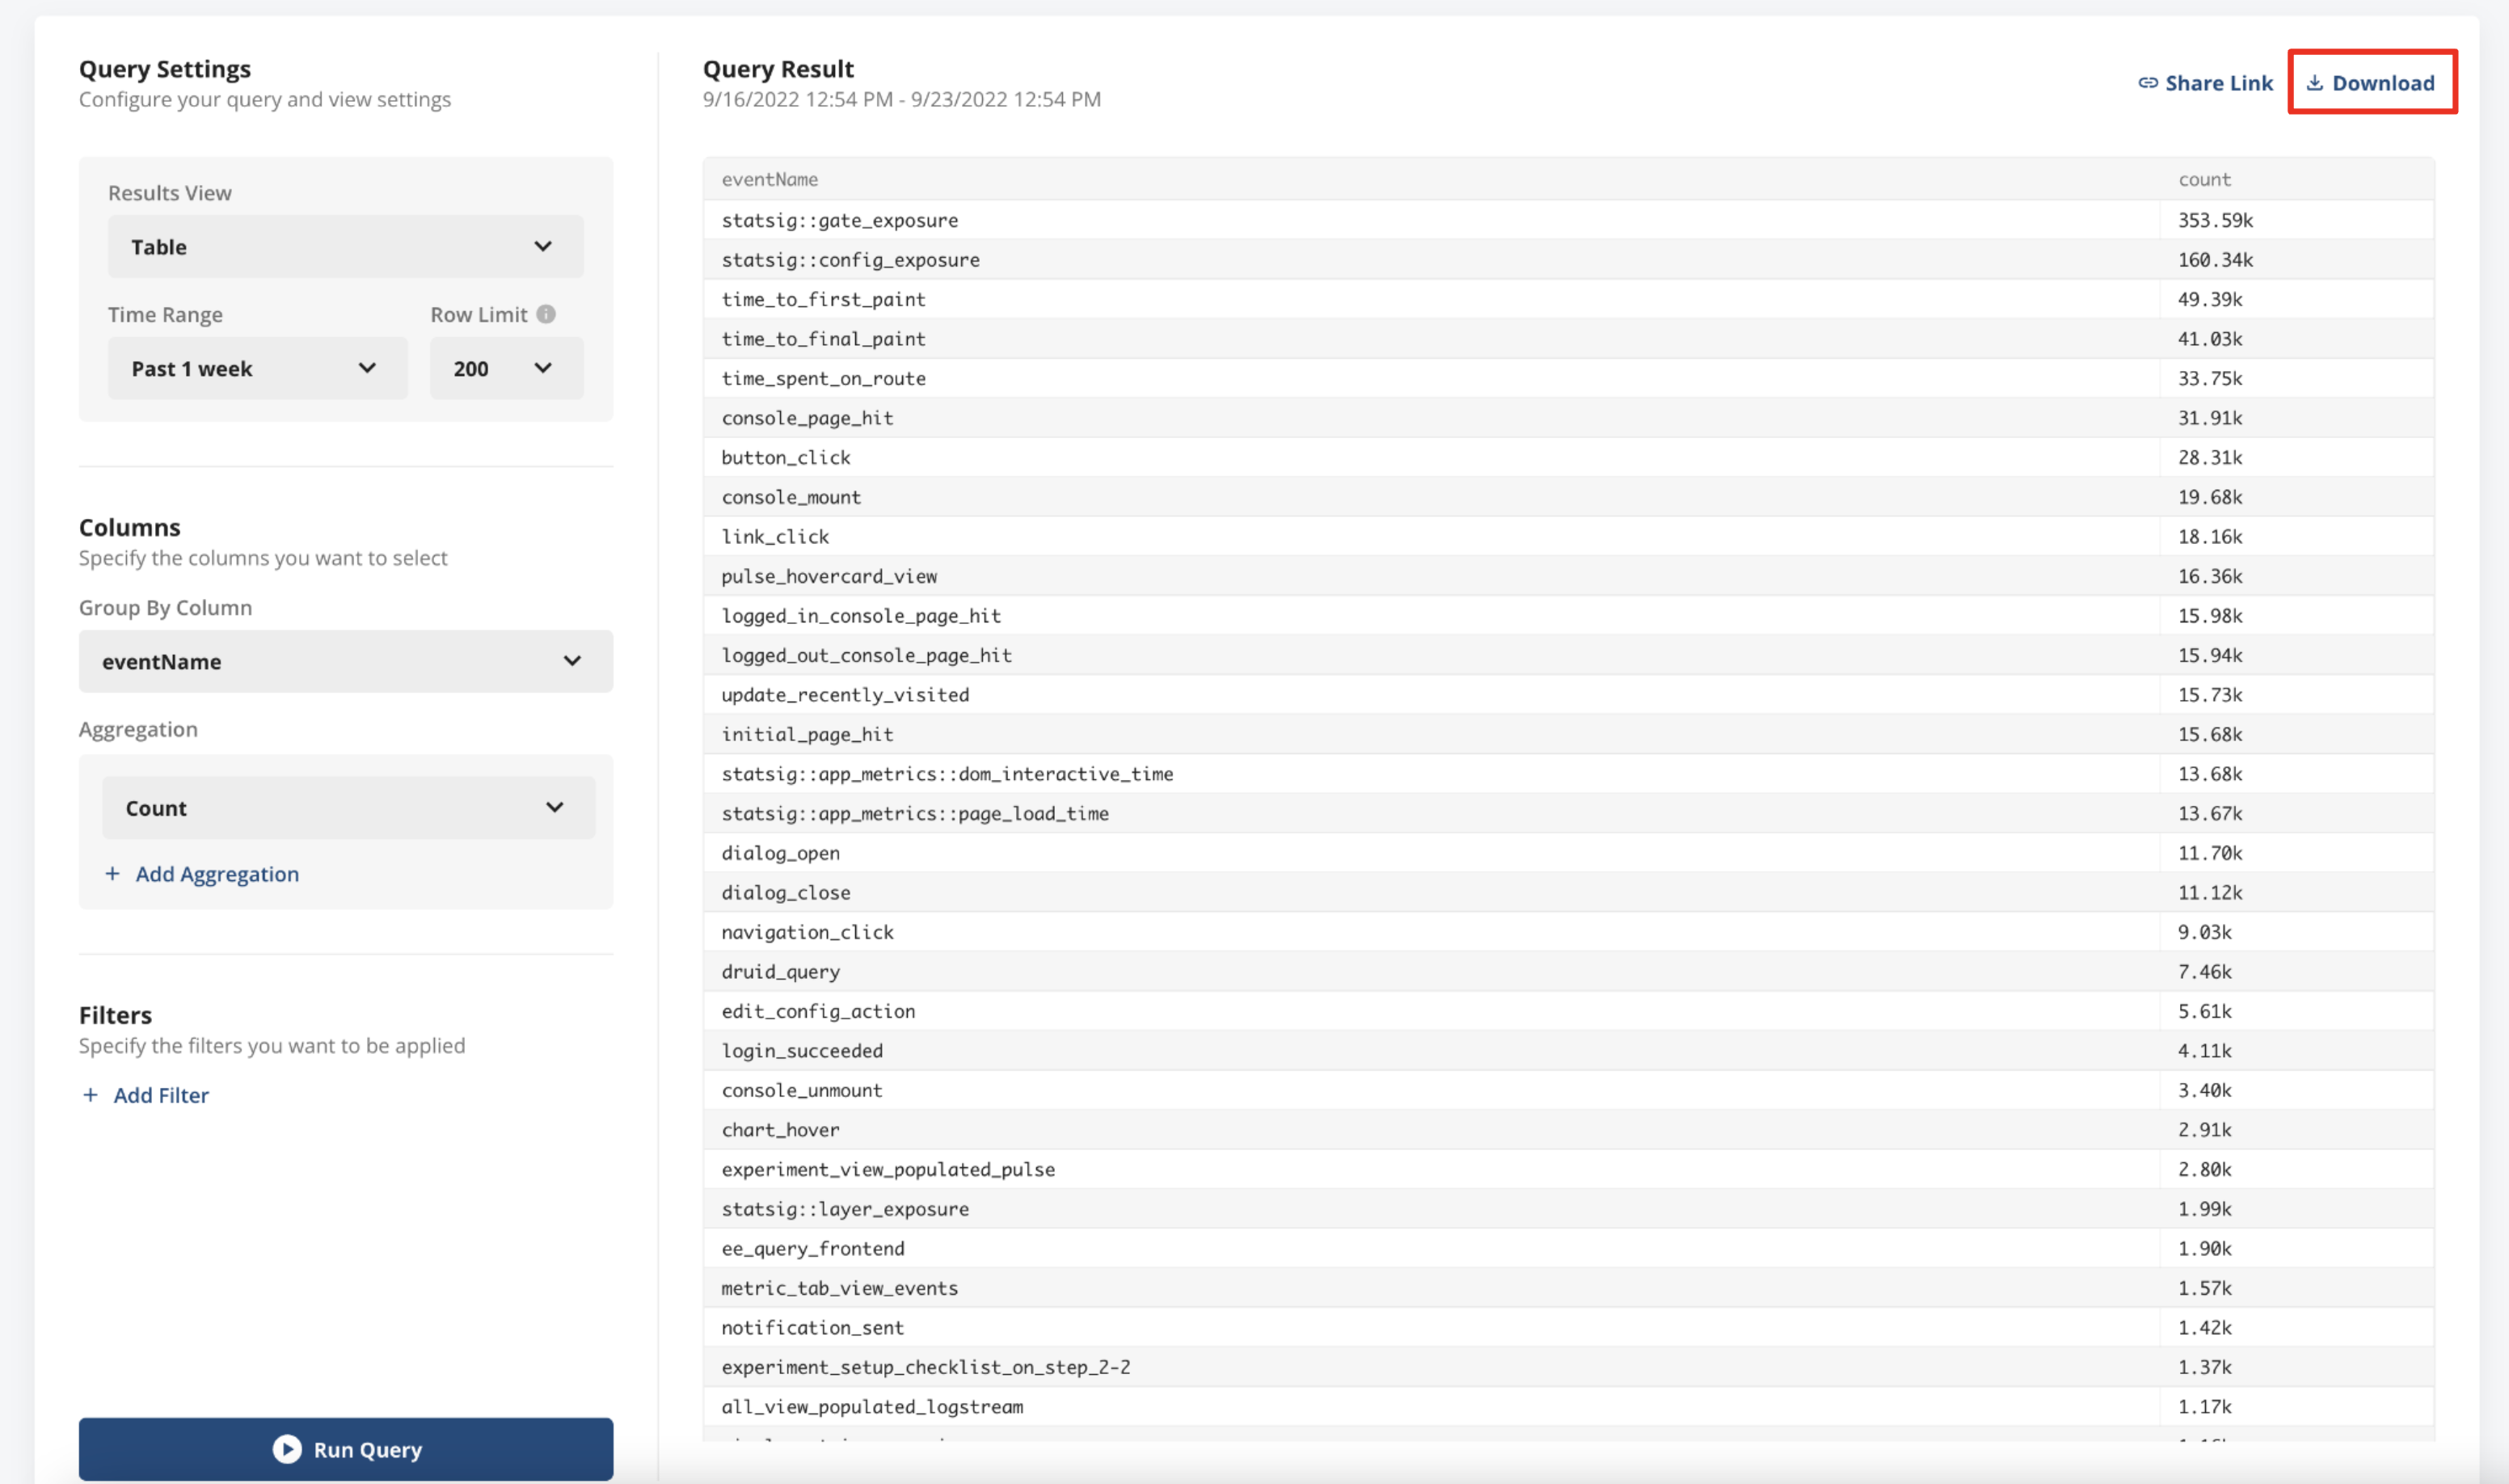
Download Events Explorer Results
We’ve made double-clicking on data generated in Statsig even easier, by enabling you to download your Events Explorer results in CSV format. Please note that this is only available for Table and Sample views.
P.S.- Keep your eyes peeled for something special in the Statsig Console…
Good morning, Statsig Community! Fun launch update to start off your Thursday- announcing your new Home Tab!
Home Tab
Today, we’re starting to roll out a brand new tab in your Statsig Console, the Home Tab. The Home Tab serves as a launchpad into all the most important things happening in your team’s Statsig project.
Key features include-
Velocity Charts- helps teams easily track their experimentation and launch velocity
Core Metrics- A preview of the metrics with the "Core" tag to will show up on your Home Tab. If you haven’t tagged any metrics with "Core" yet (or you want to change which metrics are marked "Core"), you can manage this tag via the Metrics tab.
Quick Links- Shortcut links to Statsig resources, ability to invite new team members to your Project, and one-tap creation of a new Experiment, Feature Gate, etc.
Feed- Surfaces recent activity, making keeping tabs on what your team is testing and launching easy
Snowflake, Redshift, BigQuery Data Warehouse Support
We’re thrilled to announce that today we're rolling out native integrations with popular data warehouses (DWs) including Snowflake, Redshift, and BigQuery. Now you can import metrics directly from your existing DW tables and automatically include them in the results of all of your experiments, feature gates, and holdouts.
Ingesting precomputed metrics from DWs was been a common request from customers who have a well-established modern data stack. Our new native DW integrations enable you to immediately start measuring your team’s core metrics and KPIs for every product launch as you scale out product experimentation with Statsig
You can now simply enter your DW connection string in the Statsig console, map data in your tables to Statsig fields, and start to automatically ingest precomputed metrics into your project to observe metric shifts for every product update.
To get started, navigate to Metrics from the left-hand navigation panel and click on the Ingestion tab to add new metrics. In addition to ingesting metrics daily, you run an initial backfill to bootstrap your Metrics Catalog and validate that the integration is working as expected. To learn more, visit our documentation for Data Warehouse Ingestion
You can start ingesting precomputed metrics and raw events from Snowflake, Redshift, and BigQuery today, with support for Databricks coming soon. To request access, please hit us up!
Explore Tab, Search Improvements, and More!
Some launch announcements to spice up your mid-week As always, don't hesitate to reach out if you have questions or feature requests!
Explore Tab
Today, we’re rolling out two new surfaces within Pulse to enable you to more easily analyze custom cuts of Pulse via an improved Custom Query interface. The Explore tab will enable creating quick, inline Custom Query explorations on your Pulse results, building a history of queries authored across the team that can be re-used/ modified by anyone leveraging the Explore tab. If a particular Custom Query is useful to look at on an ongoing basis, you can easily schedule the query to automatically run daily, which will live in the Scheduled tab.
Explore is currently live on Experiments only, and will be coming soon for Feature Gates.
Search Improvements
You asked, we listened! As teams have scaled their usage of Statsig, we’ve seen the need for increasingly powerful search capabilities. Today, we’re starting to roll out Statsig Search 2.0, which includes the ability to search by Creator and Tag in addition to entity name, as well as includes a list of “Recently Searched” history as the default search null state to make getting back to your recently viewed entities extra easy.
Adding Tags at Experiment & Gate Creation
Today, we’re opening up the ability to add tags to Experiments and Feature Gates at the point of creation, making it even easier to organize Experiments and Gates by team, company goal, etc. This addition will enable adding both existing tags, as well as creating new tags directly inline from the Experiment and Gate creation modals.
New Types of Custom Metrics
As more and more teams have started leveraging Custom Metrics, we’ve heard a consistent ask to support more metric types. Today, we’re debuting four new types of Custom Metrics:
Composite Metrics:
Ratios of two other already-existing metrics; this option exists within the “Ratio” metric type
Event User (Count Any and Count All):
Users that have any or all of a set of (non-filtered) events
Event Count Custom: A count of a set of (non-filtered) events
Event User Max Rollup: Users that have logged a target event at least once
Please note- previews do not yet exist for these new Custom Metric types, but will be coming soon.