Products
Solutions
Resources
Product Updates

🪵 Console Logs in Session Replay + Activity Pane Revamp
Session Replay now includes a Console Logs view, detailed inspectors for any logged event, and a new Overview section.
What You Can Do Now
View browser console logs captured during a replay, including info, warnings, and errors.
Inspect any individual console log to see full details for that entry.
Inspect any logged event from the Activity pane to see a detailed breakdown of that event instance.
Use the new Overview section to see key user and session metadata for the recording.
How It Works
Console Logs. Setup console logs capture as part of Auto-capture through that Statsig SDK. Once that is set up, you can open a replay, expand the Activity pane, and select Console Logs. Click the inspection icon next to a specific log to view its details.
Event Details. In the Activity pane, click on "Events" and then click the inspection icon next to any event to see its properties and context for that exact instance.
Overview. Open the Overview section in the Activity pane to see recording-level details about the user and associated session metadata.
Impact on Your Analysis
Faster debugging with console context aligned to moments in the replay.
Clear visibility into what the browser reported at the same time a user took an action.
Quicker triage by drilling into the exact event or log entry without leaving the replay.
Available Today
Open any session replay to try Console Logs, the event inspectors, and the new Overview section in the Activity pane.
🧮 Sum Property Values at Funnel Conversion
You can now sum a numeric event property for the final step of a funnel to quantify value generated by conversions.
What You Can Do Now
Attribute revenue to a funnel by summing a property like order_value on the conversion step.
Measure other totals such as items_count, credits_used, or time_spent for converted units.
View the total directly in the funnel table as a new column on the final step.
How It Works
In your funnel’s Advanced settings, select Sum property value for last step.
Choose the numeric property from the conversion event to sum.
The funnel table adds a column on the final step showing the total for units that converted.
The sum reflects the same cohort and filters used by the funnel.
For totals across all conversion events, turn Unique Users off. With Unique Users on, each user contributes at most one conversion to the sum.
Impact on Your Analysis
Connect conversion to value by quantifying totals like revenue for the users who completed the funnel.
Compare totals across segments using your existing breakdowns to see where value concentrates.
Track changes to total value when you adjust steps, filters, or time ranges.
Available today on cloud. Coming next month for Warehouse Native.
💪 Power Analysis Enhancements
We’ve rolled out several updates to make Statsig’s Power Analysis Calculator more powerful and easier to use when planning experiments.
You can now:
Review multiple metrics side-by-side to see how power and duration vary across key metrics in one view.
Set a target MDE across your metrics to clearly see the optimal experiment duration across your metrics.
Share results with saved configurations, so your team sees the same inputs and assumptions when reviewing analysis.
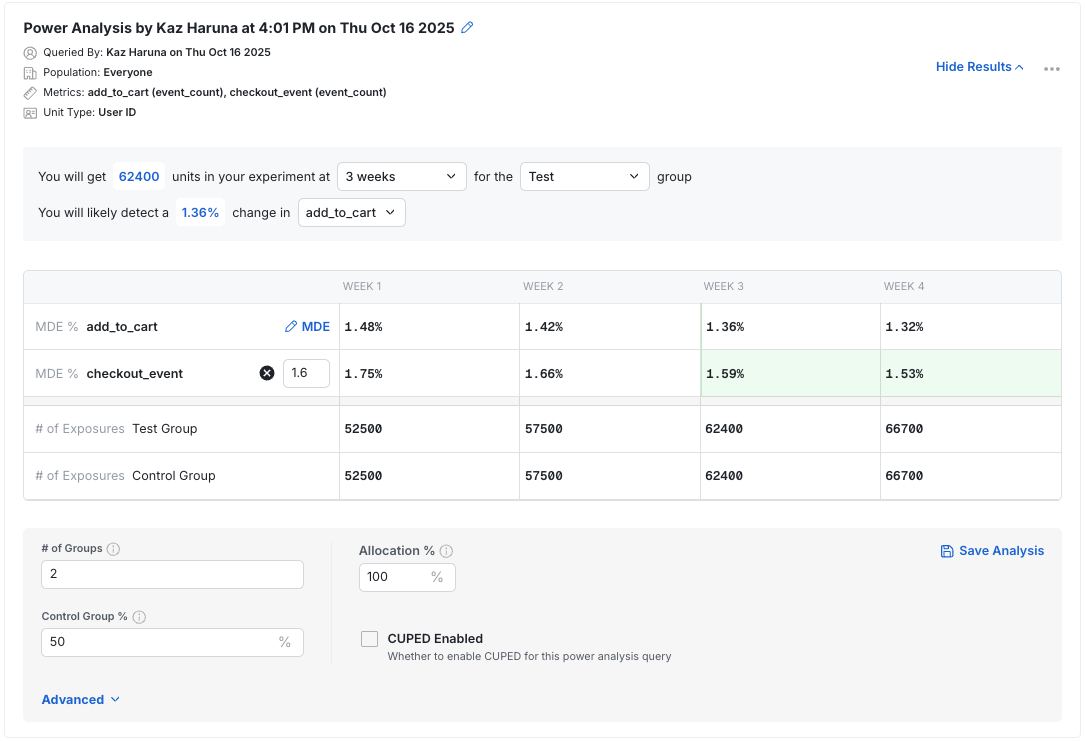
For Statsig Cloud users, Power Analysis now supports multiple qualifying events and event parameter filters, allowing more precise reflection of your experiment setup and traffic definitions.
With these updates, users can plan well-powered experiments and better align on timelines with your team.
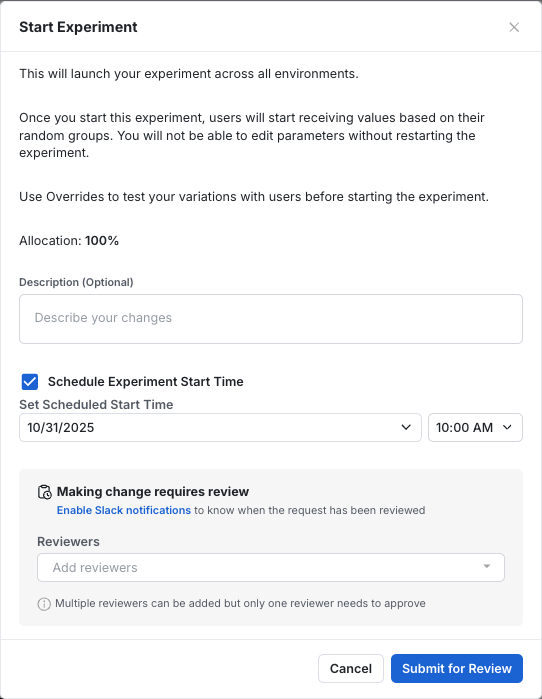
⏰ Schedule Experiment Start
You no longer need to manually start your experiments. This is especially helpful when coordinating launches with other activities, like email campaigns, or when organizing experiment start times across your organization.
You can find this feature today in the "Start Experiment" dialogue.
🔎 Warehouse Events
All events across your multi-event metric sources can now be found in one place. No more digging through different metric sources to find the event you want. Just search for the event and use it.
What You Can Do Now
Search across all events from multi-event metric sources in a single view.
Add events to your metrics without opening individual metric sources.
Search by event name or by metric source name to keep related events together.
How It Works
This unified view includes events only from metric sources that are explicitly configured as multi-event.
A multi-event metric source contains multiple event types, for example page_view and checkout. It is not a single computed metric, and it is not a single-event source.
To make a source multi-event, go to the metric source page and set Configure for Metrics Explorer to Multi-event.
The unified view supports search by event name and by metric source name.
This view is optional and does not replace existing create or edit flows. If you prefer working from Metric Sources, those flows are unchanged.
Impact on Your Analysis
Faster event discovery when you do not remember which source an event belongs to.
Less context switching while building metrics in Metrics Explorer.
Better visibility across similar events from different sources in large warehouses.
Warehouse Native users can use the unified event view to quickly find, add, and work with events across your multi-event metric sources.
🚪Feature Gate Exposures in Metrics Explorer
You can now treat Feature Gate exposure events like any other event in Metric Drilldown and Funnel analyses. This capability is available on both Cloud and Warehouse-Native and currently includes first exposures for each user.
What You Can Do Now
Use Feature Gate exposure events in Drilldown charts to track exposure trends over time
Add a gate exposure as the first step of a funnel to measure post-exposure conversion paths
Group or filter by gate-related properties, such as gate name, pass/fail result, or environment
Compare user behavior across gate conditions to understand the impact of gated rollouts
How It Works
Exposure logging When a user is evaluated against a gate, a first-exposure event is recorded with relevant gate properties and user context.
Event selection In both Drilldown and Funnel charts, gate exposures appear in the same event picker you already use for other events.
Property handling Exposure events include gate metadata and user properties, enabling the same group-by and filter controls available for other event types.
Impact on Your Analysis
Drilldown
Validate rollout health by visualizing exposure volume and distribution over time
Debug exposure logging by spotting spikes, drops, or unexpected gaps
Align exposure activity with key metrics to confirm rollout timing and behavior
Funnels
Measure user journeys starting from a user’s first gate evaluation
Identify conversion differences between users who passed or failed a gate
Attribute downstream changes to specific gated experiences
This brings Feature Gate exposure analysis into Metrics Explorer, helping you debug, validate, and measure the real-world effects of gated rollouts across both Cloud and Warehouse-Native environments.
👨⚕️ Docs v2
Following 4.5 years in our previous codebase and infrastructure, we're excited to announce the second iteration of the Statsig Documentation!
New UI/UX
Docs v2 comes with a vastly updated UI, including revamped codeblocks, tabs and dropdowns, and tidied-up navigation and page structure.
New Features
Docs v2 features some new features that make it easy to pull Statsig's docs into your LLMs' context, get answers with AI, and more. We also have a brand new API playground for our Console API and HTTP API, making it easy to grab code snippets in your language of choice or get a sample cURL.
As always, our docs remain open source and free for the community to contribute to. We make our docs better every day, if you find anything that needs some love, let us know in Slack!

📈 Autocapture Updates
Statsig Autocapture allows you to track events on your website such as page views, clicks, scroll depth, etc. with just one line of code. Today, we are excited to announce 4 major updates that will help you measure and provide more context around user behavior and site performance.
🔗 To start using Autocapture, refer to the setup guide in our docs:
1. Expanded Autocapture Events
Autocapture now tracks additional user actions, including:
Form changes
Clicks across more element types
Text input
Rage clicks (repeated clicks in frustration)
Dead clicks (clicks that lead to no action or broken links)
Copy/paste actions
2. UTM Parameters
UTM tags are now automatically captured, allowing teams to understand where traffic is coming from. Captured parameters include source, campaign, medium, content, and term.
3. Web Vitals
You can now track key performance metrics directly through Autocapture:
Cumulative Layout Shift (CLS)
First Contentful Paint (FCP)
Last Contentful Paint (LCP)
Time to First Byte (TTFB)
4. Web Analytics Dashboard
A refreshed Web Analytics Dashboard is now generated when you set up autocapture. It provides visibility into traffic trends, channel breakdowns, visitor demographics, and performance metrics. Each chart is customizable for filtering and segmentation.

📝 Statsig Visual Editor
Following two previous iterations under the "Sidecar" title, Statsig's third-generation visual editor is here, simply called the Statsig Visual Editor. The Visual Editor, like Sidecar before it, lets you start experiments without writing code but still use Statsig's powerful Stats Engine to get results faster. The Visual Editor experience is centered around the Statsig console (instead of in a Chrome Extension), meaning your Visual Editor experiments sit alongside your product experiments in the console. Alongside the in-console experience, the Statsig Visual Editor is designed to be vastly simpler to use vs. previous iterations, and have fewer hiccups going from idea-to-experiment.
The Editor is in an open beta, you can get started by reading the docs or choosing the "Visual Editor" experiment type when creating an experiment in the console!
💰 Rich Text Widgets on Dashboards
Overview
You can now add rich text widgets to any dashboard. This is a new option in addition to existing header text widgets, which remain for simple dividers.
What You Can Do Now
Write context directly on dashboards with formatted text
Use headings, bold, italics, lists, and links
Format with Markdown or the widget’s built-in controls
How It Works
On a dashboard, add a widget and choose Rich Text.
Enter your content.
Format using Markdown or the toolbar, then save.
Impact on Your Analysis
Make dashboards self-explanatory with metric definitions, scope, and caveats next to the charts
Reduce back-and-forth by capturing conclusions, decisions, and next steps inline after reviews
Speed up onboarding by explaining how to read the dashboard and why certain cuts or filters are used
Link out to specs, tickets, or experiments so readers can get more context without leaving the page
Available now on all dashboards. Try adding a Rich Text widget to provide context where it’s most useful.