Products
Solutions
Resources


Experimentation is a critical component of data-driven decision-making.
At its core, experimentation allows businesses to test hypotheses and make informed decisions based on the results. For companies using Google Analytics (GA) and looking to leverage their data for experimentation, integrating with Statsig Warehouse Native (WHN) can be a powerful solution.
This guide will walk you through the process of setting up experiments using your Google Analytics data within BigQuery, and how to utilize Statsig WHN to analyze the results.
Google Analytics is a robust tool for tracking website and app performance, but it doesn't directly egress data for integration with other services, except for BigQuery. By exporting your GA data to BigQuery, you can then connect it to Statsig WHN to run experiments and gain deeper insights.
In this article, we'll cover the prerequisites, step-by-step instructions on setting up metric sources, metrics, and assignment sources in Statsig based on Google Analytics events in BigQuery, and provide specific examples and data structures required for a successful integration.
Prerequisites
Before you begin, ensure you have the following:
A Google Analytics account with data being exported to BigQuery.
A Statsig account with access to Warehouse Native features (typically available for Enterprise contracts).
Basic knowledge of SQL and familiarity with BigQuery's interface.
Step 1: Connect your data
BigQuery setup
Export Google Analytics data to BigQuery: Set up a data export from Google Analytics to BigQuery. This is a feature available in GA360, Google's premium analytics service. Follow Google's documentation to link Google Analytics to BigQuery.
Verify data in BigQuery: Once the export is set up, data from Google Analytics will be available in BigQuery in a dataset, typically updated daily. Ensure that you have the necessary tables containing event data that you wish to use for experimentation.
Statsig WHN setup
Access to Statsig Warehouse Native: If you don’t have a Statsig Warehouse Native account, please get started here.
Connect to BigQuery: Follow the docs to establish a connection between Statsig and BigQuery.
Create an isolated dataset: It's recommended to create an isolated Dataset or Schema in BigQuery that Statsig's service user has write access to. Statsig will use this to save intermediate results and experimental data.
Step 2: Define metric sources in statsig
Metric sources in Statsig represent the views into your data that you want to analyze. They are defined by SQL queries against your BigQuery tables.
Navigate to Metrics: In the Statsig console, go to the Metrics section and select Metric Sources.
Create Metric Source: Click Create to add a new Metric source. Provide a relevant name and description.
Define SQL query: Input a SQL query that represents the data you want to turn into a metric. For example, if you want to create metrics based on all of your GA events, your query might look like this:
This query selects the necessary fields from the GA sessions table. Consider adding columns you may use for custom attributes, or custom metrics, into the query.
Step 3: Define metrics in Statsig
After setting up your metric sources, you can define metrics that will be used for experimentation.
Create a new metric: In the Metrics section, click on Create Metric.
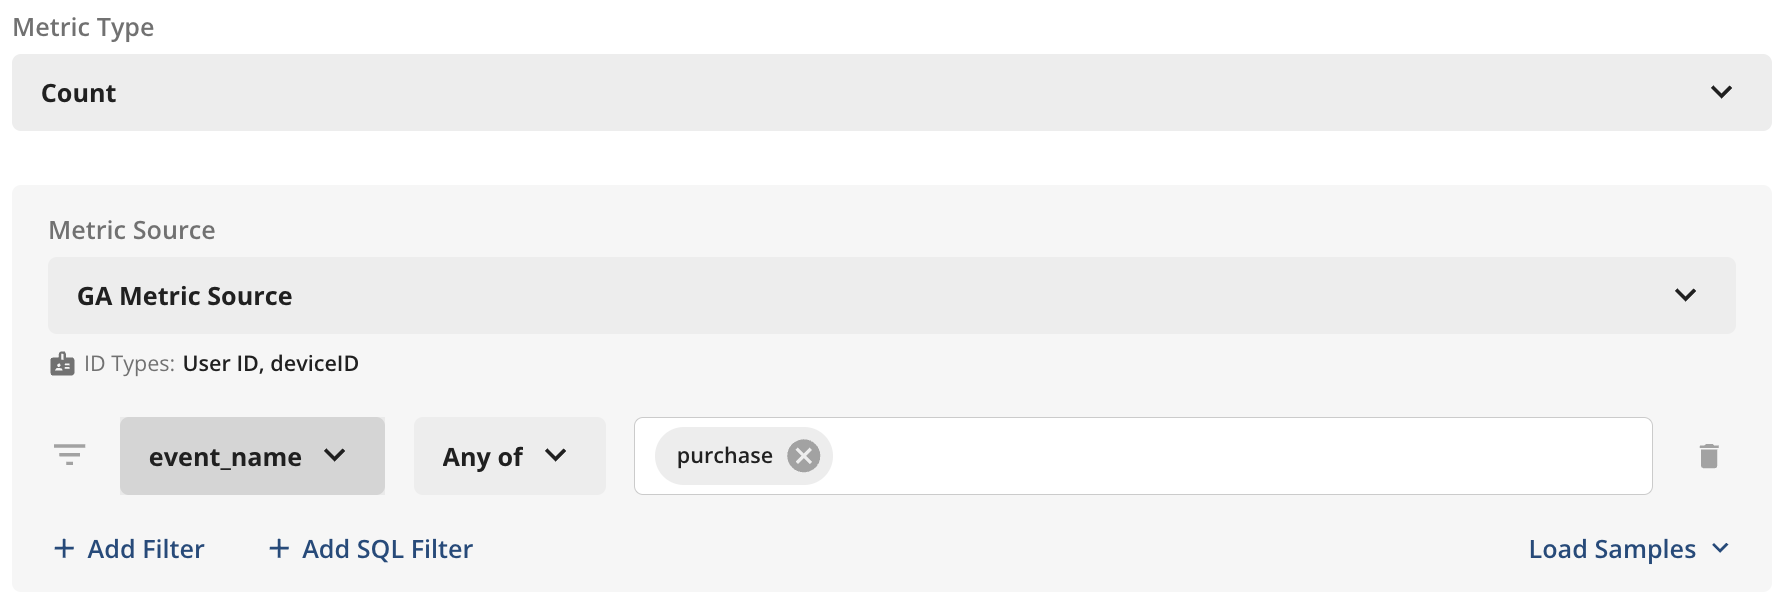
Configure metric: Select the metric source you created and define the metric type (e.g., count, sum, average).
Set up metric parameters: Specify the parameters such as the user identifier and the event parameters that you want to measure.
Step 4: Define assignment sources in Statsig
If you are tracking your experiment assignment events (an event denoting when a user was exposed to an experiment) through GA, you can analyze these as experiments in Statsig using Assignment Sources. Assignment Sources are where Statsig will look for experiment assignment events.
Navigate to experiments: In the Statsig console, go to the Experiments section.
Create assignment source: Click on Assignment Sources and then Create.
Specify data source: Use a SQL query to define where Statsig should look for assignment events. This could be a table in BigQuery that tracks user assignments to different experiment groups.
This query assumes you have a table that tracks which variant of an experiment each user has been assigned to. If you don’t, you can use Statsig’s SDKs for experiment assignment.
Step 5: Run experiments and analyze results in Statsig
With your metric sources, metrics, and assignment sources defined, you can now run experiments and analyze the results directly in Statsig.
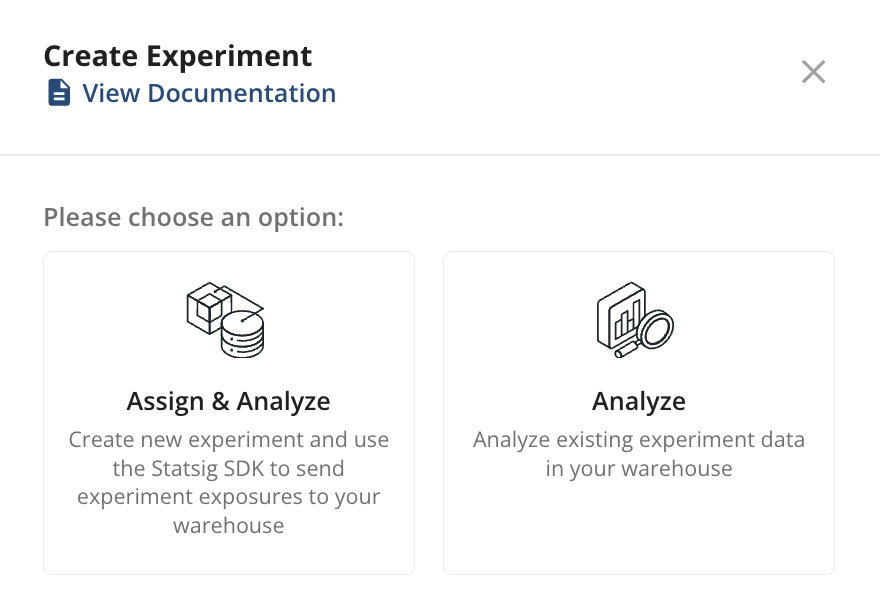
Start an experiment: Create a new experiment in Statsig using the assignment and metric sources you've set up.
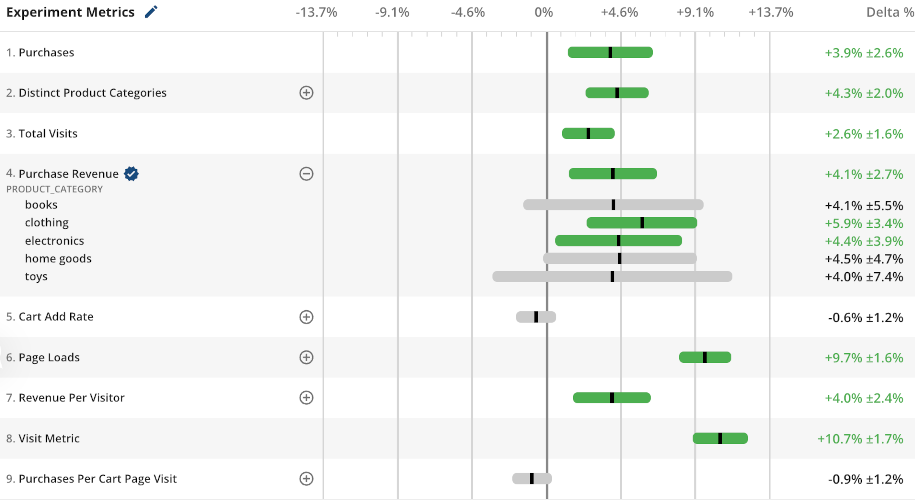
Monitor results: Use Statsig's dashboard to monitor the experiment's performance and analyze the results.
Happy experimenting!
By following this guide, you've learned the basics on how to leverage your Google Analytics data within BigQuery to run experiments using Statsig Warehouse Native.
For advanced exploration, consider diving deeper into Statsig's documentation and experimenting with different types of metrics and analyses. If you encounter any issues or have specific questions, don't hesitate to reach out to Statsig support for assistance.
Remember, experimentation is an iterative process, and the insights you gain today can lead to better user experiences tomorrow. Happy experimenting!
Request a demo
