Products
Solutions
Resources

Imagine a world where your team can use one tool to build, analyze, and improve your product.
Unfortunately, tools don’t often work well together. Teams have to spend precious time stringing together point solutions to get data flowing from one platform to another. Even when everything is set up, there are often still discrepancies. Do you trust the infra dash or the product metrics dash? How are the metrics defined? It’s a mess.
Today, we're thrilled to alleviate this pain point with our latest feature: Statsig Product Analytics. Our newest product analytics suite promises to redefine how you interact with your metrics, by providing more analytics power directly within the Statsig platform.
What is Statsig Product Analytics?
Statsig Product Analytics is a dynamic analytics surface that offers powerful slicing capabilities for your events and metrics:
Want to understand metrics based on device type, country, or user tier? With Product Analytics, you can break them out seamlessly.
Want to understand how users convert between different actions? Create a funnel between any events you’ve logged.
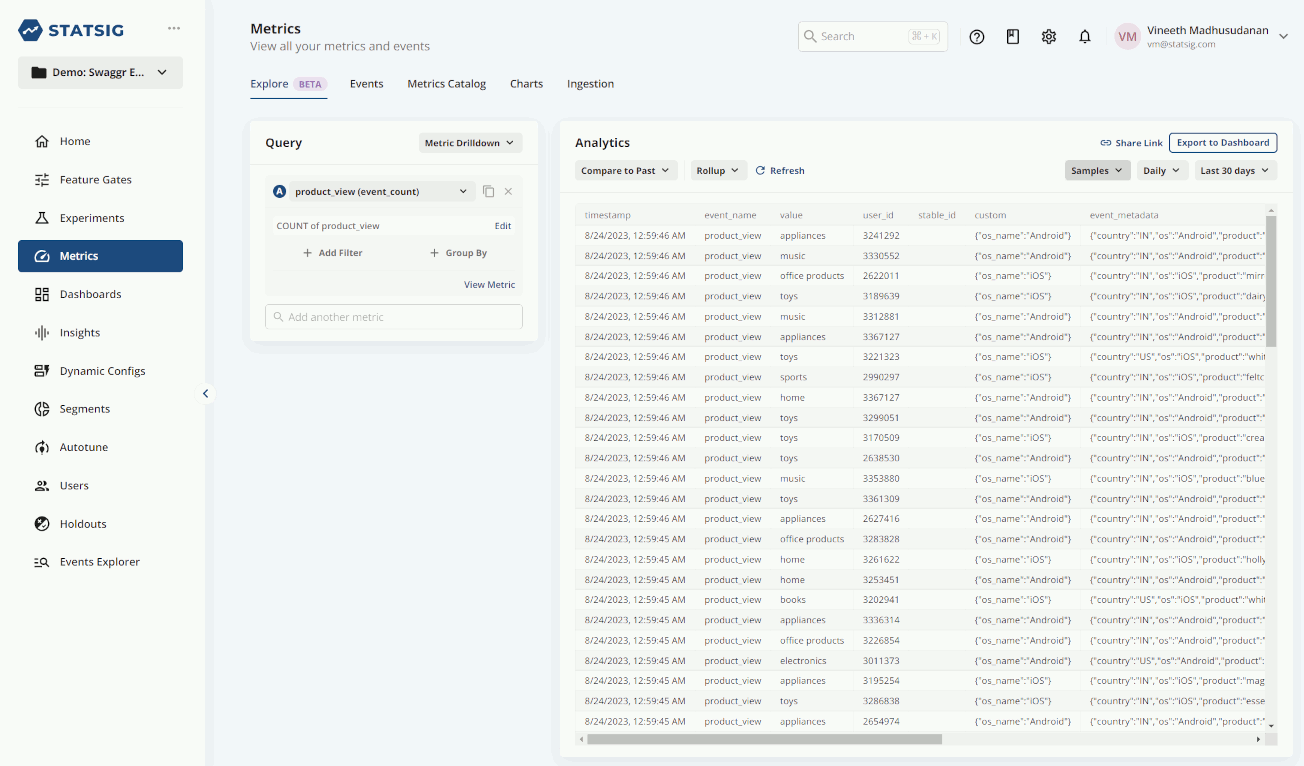
The ultimate goal? Delivering data you can unequivocally trust. Data that provides actionable insights, enabling you to drive growth more effectively than ever before. Discover Product Analytics under the path: Metrics -> Explore.
The current beta is optimized for startups that want analytics. Like we did for experimentation, we’re growing the surface area of this product rapidly. We're all ears—let us know your feedback and what enhancements you'd like to see via our Slack community!
"[Statsig's product analytics suite] allows us to perform deep data analyses that empower critical business decisions all in one place. This saves us from having to invest time and resources into building custom data pipelines and dashboarding."
Ahmed Muneeb, CTO @ LAAM
Common product analytics use cases
1. Metric drilldown
Choose from multiple events, group them by user properties, and implement filters to observe their collective movement.
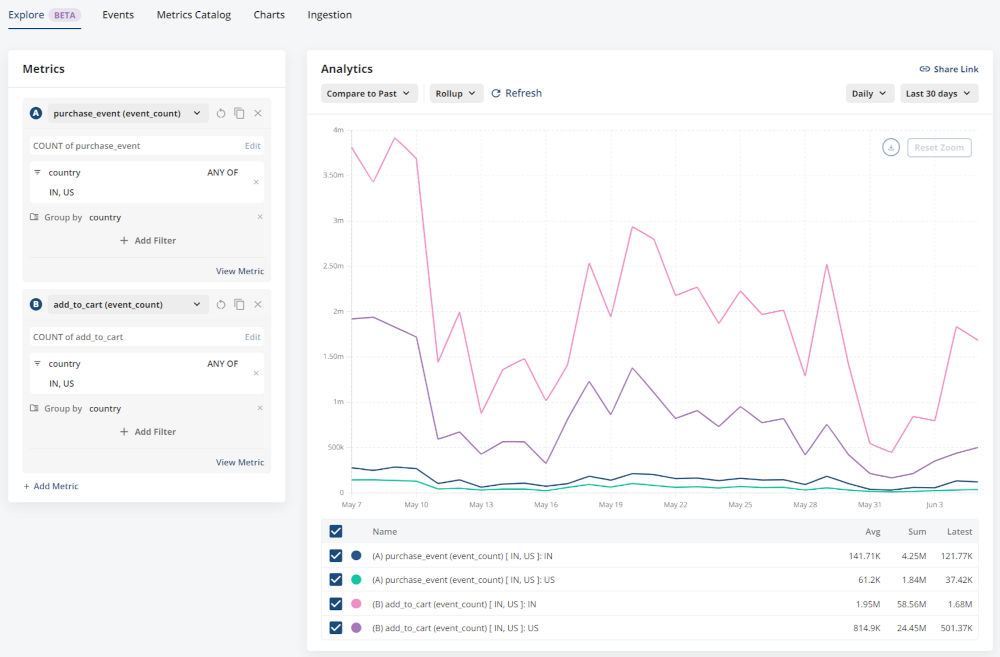
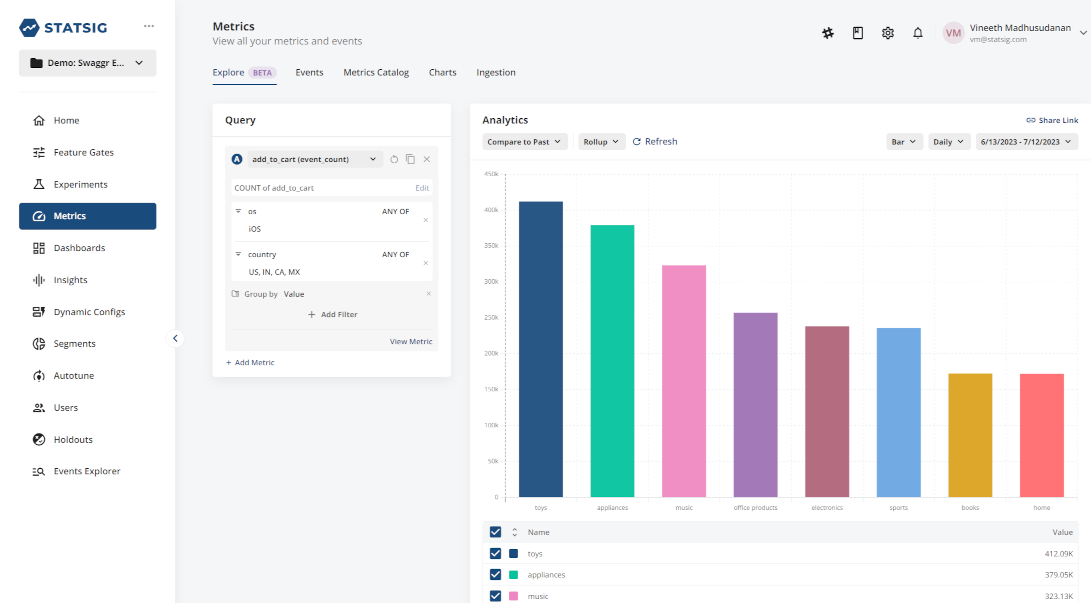
Prefer bar charts? Switch with ease to visualize comparisons and distributions more intuitively. What's more, you can directly download these charts as CSV files for further analysis.
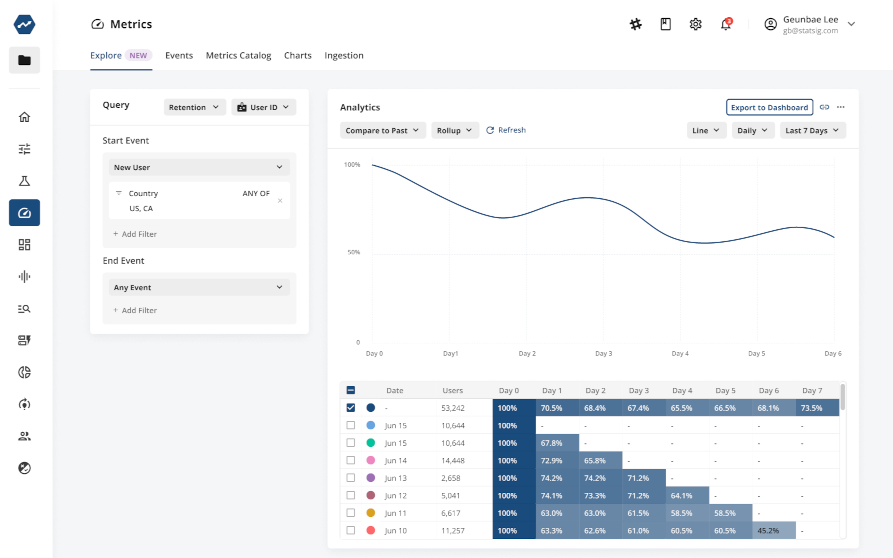
2. Retention analysis
Master product adoption with Retention Analysis. Gain insights on how frequently users return to your platform post a specific activity.
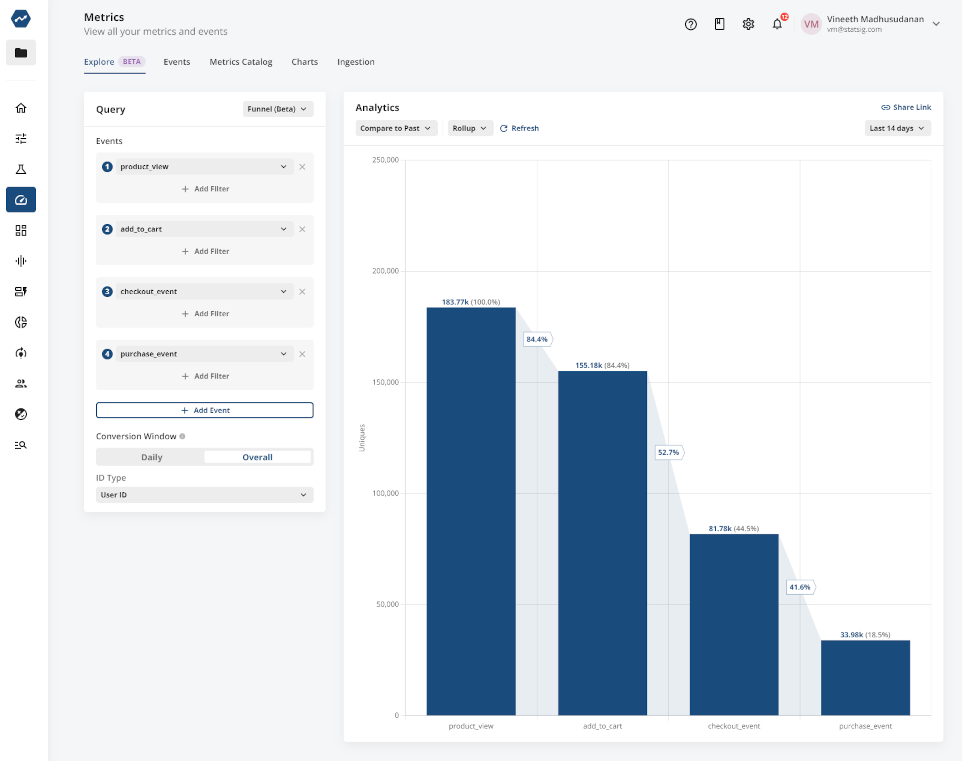
3. Funnel analysis
Grasp the user journey better by configuring funnels. Understand their navigation patterns and more importantly, identify points where they decide to exit or drop off.
4. Data samples
Suspect data anomalies? Delve into samples of your core data to investigate and address issues head-on.
Statsig Product Analytics is a testament to our commitment to providing robust, user-friendly solutions.
Efficiency meets insight
Our aim? Liberating product builders from tedious number crunching and enabling them to make informed decisions. Metrics Explorer will help increase iteration velocity like never before.
Introducing Product Analytics
Why Statsig?
Our mission? Bringing sophisticated, big-tech tools to developers, data scientists, and product managers globally. Our commitment? Continuous improvement, regular feature releases, transparent documentation, and fostering an open experimentation community. With Statsig, you're always building at pace.
Happy building!
⭐ Related: Statsig Web Analytics helps you understand and optimize your website usage.
Get started now!
