September was a big month for Statsig!
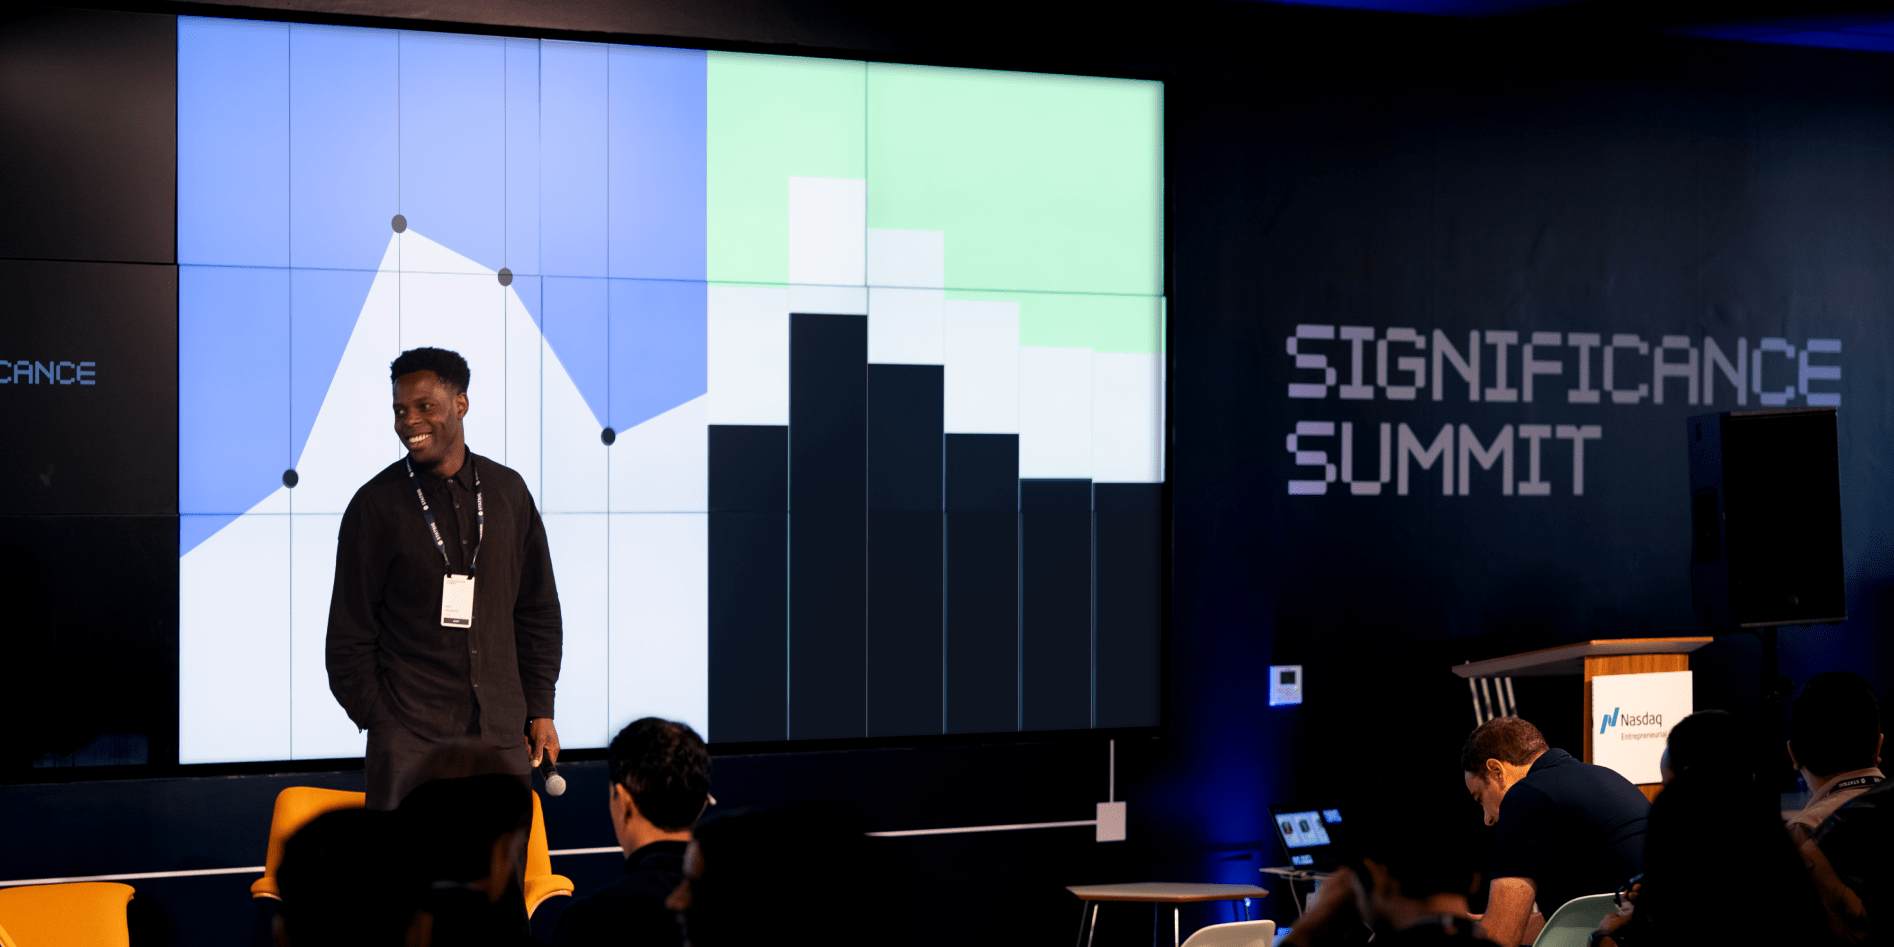
On September 25th, our team kicked off the first-ever Significance Summit—a conference focused on bringing together the best in product development to talk about the importance of data-driven decision-making.
After a year in the works, we launched this event and brought together a fantastic group for a day of sessions and networking in San Francisco. We’re eager to share insights and stories from that day through a series of on-demand videos and upcoming blogs.
We’re kicking off this series with a recap of our opening session with Statsig’s CEO, Vijaye Raji.
Reflecting on growth through data
This past year has been monumental for Statsig, marking one of the most dynamic periods in our history.
Our product and business landscapes have expanded vastly, mirrored by our team's growth, welcoming eight new babies into our Statsig family, and navigating unprecedented infrastructure scaling.
Perhaps the most impactful story of our year comes through statistics. Our event volume alone increased twentyfold, confronting us with infrastructure challenges that ultimately drove innovation and custom in-house solutions.
Currently, we process over a trillion events daily, translating to about 11.5 million events every second. By the end of this keynote, we had tackled 21 billion events—a staggering number that was once our daily processing capacity.
Despite this colossal load, we've achieved an impressive four nines of availability (99.99), a testament to the engineering feats at Statsig. Our footprint now reaches two and a half billion users monthly, a milestone on par with Instagram’s Monthly Active Users.

Fast-paced innovation and diversity
Experimentation and gate creation are surging on Statsig, correlating with how swiftly teams innovate.
Our customers’ ability to run experiments rapidly showcases the acceleration in product development velocity, underscoring Statsig’s role in streamlining their processes.
Interestingly, our user base has diversified beyond data scientists and engineers, to include product managers, marketers, and designers—all finding new value in our tools. This inclusivity aligns with our vision to democratize data across entire organizations, making data tools universally accessible and valuable.

Evolution from waterfall to agile: A data-driven shift
Reflecting on the evolution of software development, it's astonishing how far we've come since the days of boxed software and the waterfall model.
The agility of the build, measure, learn loop now characterizes modern software development. Real-time data now drives decisions, allowing us to pivot swiftly, a shift from the painstakingly slow processes of the past.
Statsig was born out of this necessity for rapid iteration and reliable data. From day one, our mission has been clear: to become the all-encompassing data platform that supports every facet of product building. We’ve developed sophisticated tools, from feature flagging to analytics and robust stats engines, all operating seamlessly atop modern data warehouses.
Announcing new tools to enhance product development
In keeping with our ambitious vision, we're unveiling four new products designed to further enhance your data-driven strategies:
Product Analytics on Statsig Warehouse Native: Connect to your warehouses with a single string for comprehensive user and business analytics. (This is available now.)
AI-Enhanced Marketing Tools: leveraging AI to optimize user interactions with minimal code adjustments.
ML-based Autotune
Infrastructure Analytics Beta: A game-changer, this tool integrates product and infrastructure metrics, providing causal insights tied to alerts and changes, uniquely bridging development with operations.
👀 Related: A top-secret sneak peek at our 2024 hackathon projects and features.
A future of data empowerment
"We shape our tools, and then our tools shape us."
At Statsig, we take pride in crafting tools that empower you to advance more efficiently in the evolving landscape of product development.
As we further explore the themes introduced at this summit, we anticipate sharing more detailed insights and lessons from each session to enrich your journey toward mastering data-driven product innovation.
Watch Sigsum on demand

