Products
Solutions
Resources

💡 How to decide between leaning on data vs. research when diagnosing and solving product problems
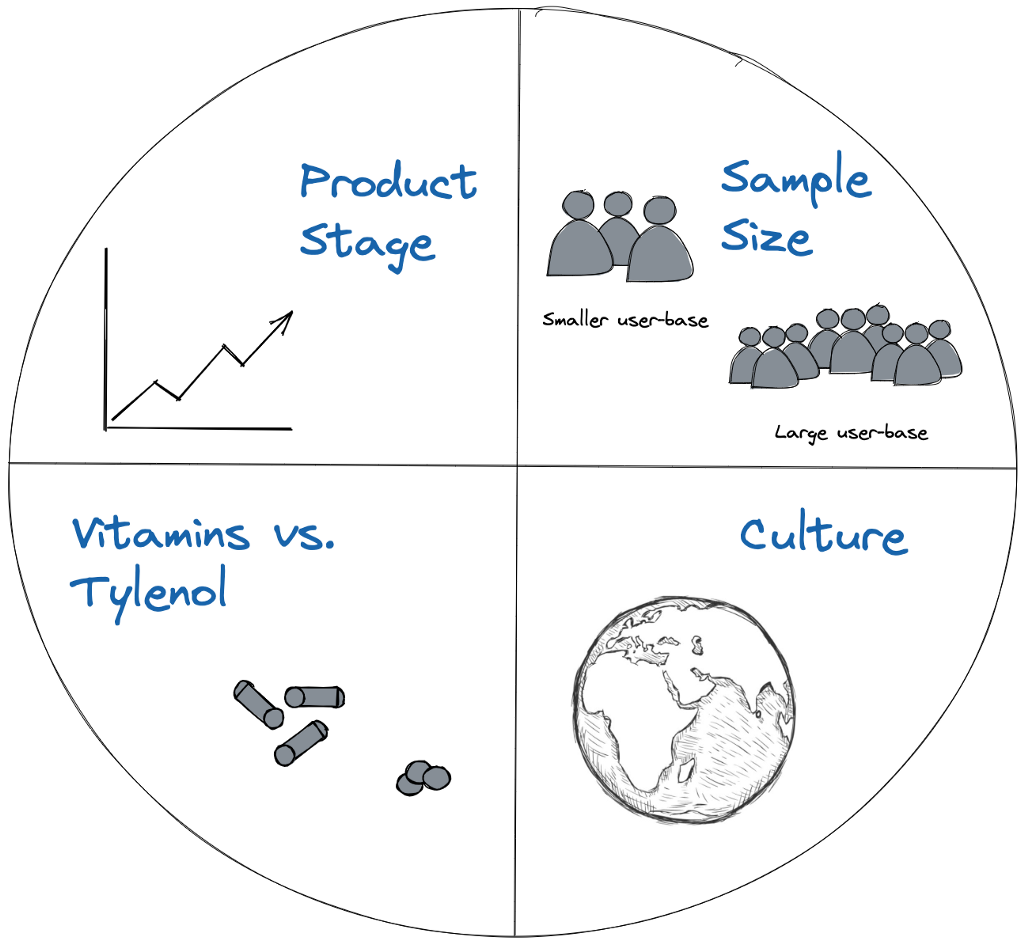
Four heuristics I’ve found helpful when deciding between data vs. research to diagnose + solve a problem. Earth image credit of Moncast Drawing.
As a PM, data and research are two of the most powerful tools in our toolkit when it comes to product development. But how do you know when to lean on each? And what are the potential risks of using the wrong one in a given scenario?
In the last 9 years, I’ve had the good fortune of being able to work on mature products with massive customer bases (Facebook, Instagram, Uber), as well as new, zero-to-one products just beginning their lifecycles (at a small fintech startup, as well as here at Statsig).
My strategy for leaning on quantitative vs. qualitative inputs to inform product strategy has varied wildly across these experiences, and I’ve had to adapt the principles I use to evaluate which method to deploy in real-time as I’ve gone.
Of course, in the span of 9 years and 4 companies I’ve gotten it right many times, but also made my fair share of mistakes along the way. Here are four shortcut heuristics I’ve observed to evaluate when to lean on quantitative vs. qualitative inputs in product development-
Product Stage (pre vs. post-product/ market fit)
Sample Size (small vs. larger user bases)
Tylenol vs. Vitamins (solving existing user pain points vs. inventing the future)
Culture (familiar vs. foreign culture)
Product Stage
Pre-product/market fit vs. Post-product/market fit
Typically, when a product is pre-product/ market fit, you double down on talking to customers to understand their pain points and then directly design solutions to these pain points. When a product is pre-product/ market fit, users often engage with the product in a mishmash of ways, and you may get a number of conflicting signals if you were to only look at the data on user behavior.
Talking to customers enables you to not just understand how customers use your product today, but what their core pain points are. Oftentimes, when you drill deeper to get to the root of a user’s problem you realize that your product today isn’t actually solving for the right- or even a real- user problem.
Example-
Having been a Growth PM for the majority of my PM career, my first bias has always been to look at data first. When I was at Instagram in one of my earlier PM roles, our analysis pointed to the fact that the more accounts and content users followed, the more engaged they were. Given this data, our mandate was to design product “hooks” that helped people follow more content. This led to products like the carousel of similar “suggested accounts” that appear when you follow an account, which was a smashing success in driving increased follows.
Fast forward 7 years to 2021, and I’m working at a small fintech for self-employed folks. From our (admittedly limited) data, we saw that self-employed folks tended to pay and get paid by other self-employed folks. My pattern-matching from my Instagram days indicated that this might be a great opportunity to put a referral upsell at the bottom of our invoice product!
However, as we rolled out the product we saw very little actual acquisition as a result of these prominent upsells. Confused, we decided to talk to some customers, who immediately told us they hated the upsell unit, and wanted to disable it or at least minimize it, as they felt it detracted from their personal brand when using our product to invoice their customers. Not only were we not actually acquiring new customers via this upsell unit, we were actively damaging trust with our existing customers- a lose-lose. Once we discovered this, we made the upsell optional in the invoice template and moved onto testing other, more organic acquisition hooks.
This was a great example of where limited data from an early-stage product didn’t tell the full story, and talking to users was a critical missing piece.
Questions to ask yourself-
Realistically, is your product pre-product/ market fit, or post-product/ market fit? (alternatively- are you trying to double down on existing, positive user behavior or create/ change user behavior?)
Do you see conflicting signals in the data that point to users engaging with your product in a myriad of ways, without a clear pattern?
Do you feel you intimately understand the root pain point your customers are experiencing that your product is solving for?
Sample Size
Small vs. Large(r) User-base Size
The size of your user-base has a big impact on whether you should reach for the data analysis or UXR tool in your toolkit. While it’s a misnomer that you can’t run A/B tests on small(er) sample sizes- see my colleague Timothy Chan’s awesome post on exactly this here- there are some bounds to how small you can go unless you expect to see a massive effect.
Generally, if your user-base is in the millions, hundreds of thousands, or even high thousands you should lean into gathering insights from quantitative methods, looking at user behavior data and running A/B tests to more scientifically derive feature impact.
If you’re working with tens or hundreds of users, you can still leverage more quantitative methods, but you need to internalize their limitations. Specifically, to see any statistically significant result in a reasonable period of time, your product changes will have to drive a massive lift in your baseline product usage. This is especially pronounced if you choose a “down-funnel” metric which sees even lower event volume than a more top-of-funnel metric. To maximize both your impact and your chance of being able to run a significant A/B test, you should try to pick one of your highest-volume metrics to move.
If you have a smaller user-base and don’t want to be stuck waiting weeks, or even months for an A/B test readout, lean into more qualitative methods to understand the impact a feature is having on users. Survey your base, call up your users for extended 1:1 conversations to get their feedback, and track sentiment via mechanisms like NPS and CSAT.
Example-
A few weeks back, a colleague and I had a conversation with a prospective company who was evaluating Statsig. The company was a mid-sized startup, with a meaningful but not massive user-base.
During the conversation, the company asked us why our Power Calculator- which calculates the expected duration of an experiment based on a given metric’s volume and the target minimum detectable effect (MDE)- was broken. “What do you mean?” we asked. They went on to pull up the Statsig Power Calculator for the metric they wanted to move as part of their experiment, and showed how the expected duration table didn’t go past 4 weeks, and hence the minimum detectable effects seemed outrageously large.
The metric they wanted to move had roughly 25 events a day.
This is a great example of a scenario where you either need to pick a higher-in-the-funnel metric that has larger event volumes, or you should consider falling back to more qualitative inputs to guide strategy, as an A/B test on a metric with only 25 daily exposures could take a prohibitively long time to reach significance, unless you expected the product change to result in a 10x-magnitude change to the metric.

Questions to ask yourself-
How large is the user-base of the feature I want to test on? Will I be able to reach significance on an experiment in a reasonable period of time?
What is the highest-volume key result metric I can pick for my experiment?
Is baseline usage of my target feature so low that any data-driven analysis risks being super noisy and driven by outlier data points?
Tylenol vs. Vitamins
Trying to solve a pain point a user can easily quantify vs. invent the future
Our CEO Vijaye Raji often buckets problems and their product solutions into two categories- Tylenol vs. Vitamin problems. Tylenol problems are problems that users know they have and are actively seeking a solution for. A Vitamin problem, on the other hand, is a feature that is good for a user, but the user doesn’t know to ask for it- its absence is not acutely felt, but a user’s life would be significantly improved with the addition of the feature.
The tools you use to design for and iterate on a Tylenol vs. Vitamin problem differ. While Tylenol problems can be immediately diagnosed by looking at the data or sitting down and talking to users about their pain points, users often won’t stumble across Vitamin solutions by themselves, and you’ll be hard-pressed to find much historical data to guide your decision-making as you’re forging a completely new path. The classic example here is Henry Ford’s invention of the car- “If I had asked people what they wanted, they would have said faster horses.”
While the veracity of this quote is hotly debated, the sentiment stands- often, innovation does not stem from solving today’s problems, but rather inventing tomorrow’s future. Vitamin problems typically don’t rely on either quantitative or qualitative inputs, rather a leap of faith in what behavior a product creator wants to see exist in the world.
Example-
The go-to example of a Vitamin product company is Apple. Steve Jobs is perhaps one of the most iconic product visionaries, even famously saying that, “A lot of times, people don’t know what they want until you show it to them.” (Source) Jobs had a singular vision of the future, and was very vocal in believing that product development was more art than science. No existing data or user research on existing behavior or trends would have pointed to the need for the iPod, the iPhone, or Air Pods.
Jobs’ conviction was solid, and he launched hit after hit with his future-inventing, leap-of-faith Vitamin product philosophy, forming the foundation of what would become the most valuable company in the world and inspiring an entire generation of young creators.
It is true that once-in-a-generation product visionaries exist. But for every Steve Jobs, there are a thousand failed startups, started by founders who were undoubtedly equally strong in their conviction in their vision of the future as Jobs was when he founded Apple.
So while there are a class of problems where neither existing data nor research can guide your development, this class of problems carries additional risks. If you go about solving a Vitamin problem, you face even more hurdles to reach success- not only do you need to create a successful, value-creating product, but you need to convince your potential customers that their lives will be better with your product in them, as they don’t have an immediate, clear Tylenol problem to solve. This might require education, extra marketing, use-case creation, or even something as extreme as creating an entire new industry.
Questions to ask yourself-
Is my product solving a Tylenol or a Vitamin problem?
Are my users saying one thing but doing another that might point to a different core problem to solve?
If solving a Vitamin problem, what extra work do I need to do to educate my users on how much better their lives will be with my product in it?
Culture
Designing for a culture you’re unfamiliar with
Ah, culture. The true wildcard that can render both qualitative and quantitative problem-solving methodologies obsolete. Often, the tricky thing about building for another cultural context is not only not knowing how to solve users’ problems, but not even knowing what questions to ask to identify users’ true problems in the first place.
When working in new cultural contexts, it is often helpful to deploy a one-two punch of both quantitative and qualitative tactics to (1) identify, and (2) solve your users’ pain points. Start by looking at data to identify large gaps or patterns in users’ behavior that you want to double-click on. Then, armed with this set of high-level areas that you want to go deeper on, leverage UX research to talk to your users directly to get more color. If you don’t precede user research with a pass of the data to identify interesting focus areas, UXR sessions risk becoming aimless and too broad/ shallow, with little signal-to-noise on what insights the team should be focused on.
Example-
When I first joined Uber in late 2014, I joined a team tasked with unblocking growth in Uber’s international markets.
When we launched in markets like India, Southeast Asia, and Latin America, we noticed that very early post-launch growth in the market looked great, but it would quickly top out and plateau at an unexpectedly low number. We were puzzled.
As we dug into the data, we realized that new riders were dropping off in droves at the point in the sign-up funnel where they needed to add a credit card. Of course! Credit card penetration in markets like India in 2014 was still low, with only 2–3% of the population having access to a credit card.
We immediately jumped into solution mode, digging into what alternative digital payment methods we could offer. We partnered with Paytm to offer a digital wallet experience. Adoption grew slightly on launch, but it was not the panacea we had hoped it would be. We started testing other digital wallets, each with minimal impact on increasing sign-up conversion. Nothing seemed to work.
Exasperated, we got on the phone with our local Ops team in Delhi. They were shocked we were so stumped- the answer was clear as day to them. We didn’t offer the option to pay for Uber with cash. India was a cash economy; everything ran on cash!
After much convincing/ road-showing internally (read more about that saga from my former colleague Matthew Moore here), we launched cash payments in India, quickly expanding access to many more markets internationally.
Cash payment didn’t just close sign-up conversion drop-offs, it actually increased the size of our total addressable market, opening up Uber as a transportation option that tens of millions of people previously never would have even considered.
At the time I left Uber, cash payments accounted for 80%+ of first trips, and 40%+ of global gross bookings. The data couldn’t have possibly told us the magnitude of the opportunity we would unlock by talking to our teams on the ground and internalizing local market nuances.

Questions to ask yourself-
Are you working in a new cultural context, where you suspect you don’t fully understand cultural expectations/ norms?
Are you hitting a dead end when digging into trends in your user data, or do you feel that your user data isn’t telling the full story?
Have you spent time in the market you’re designing for, talking to your customers and/ or observing their day-to-day lives directly?
In Summary

As with most things in life, there’s a time and a place for everything. While I know I personally would love to have a set of easy, cut-and-dry rules I can blindly follow to decide whether to dig into the data or kick off a research study to understand a problem, the reality of a given situation can be more complex and often requires a mix of both.
That being said, hopefully the four heuristics above help provide a framework for the types of inputs that can influence when to choose each approach.
Happy Building!