A tale of three companies: Why you don’t need millions of users to succeed in experimentation

There's a common misconception that companies need a large user base to see value from experimentation.
We've addressed this myth before, but feel it's important to revisit the topic.
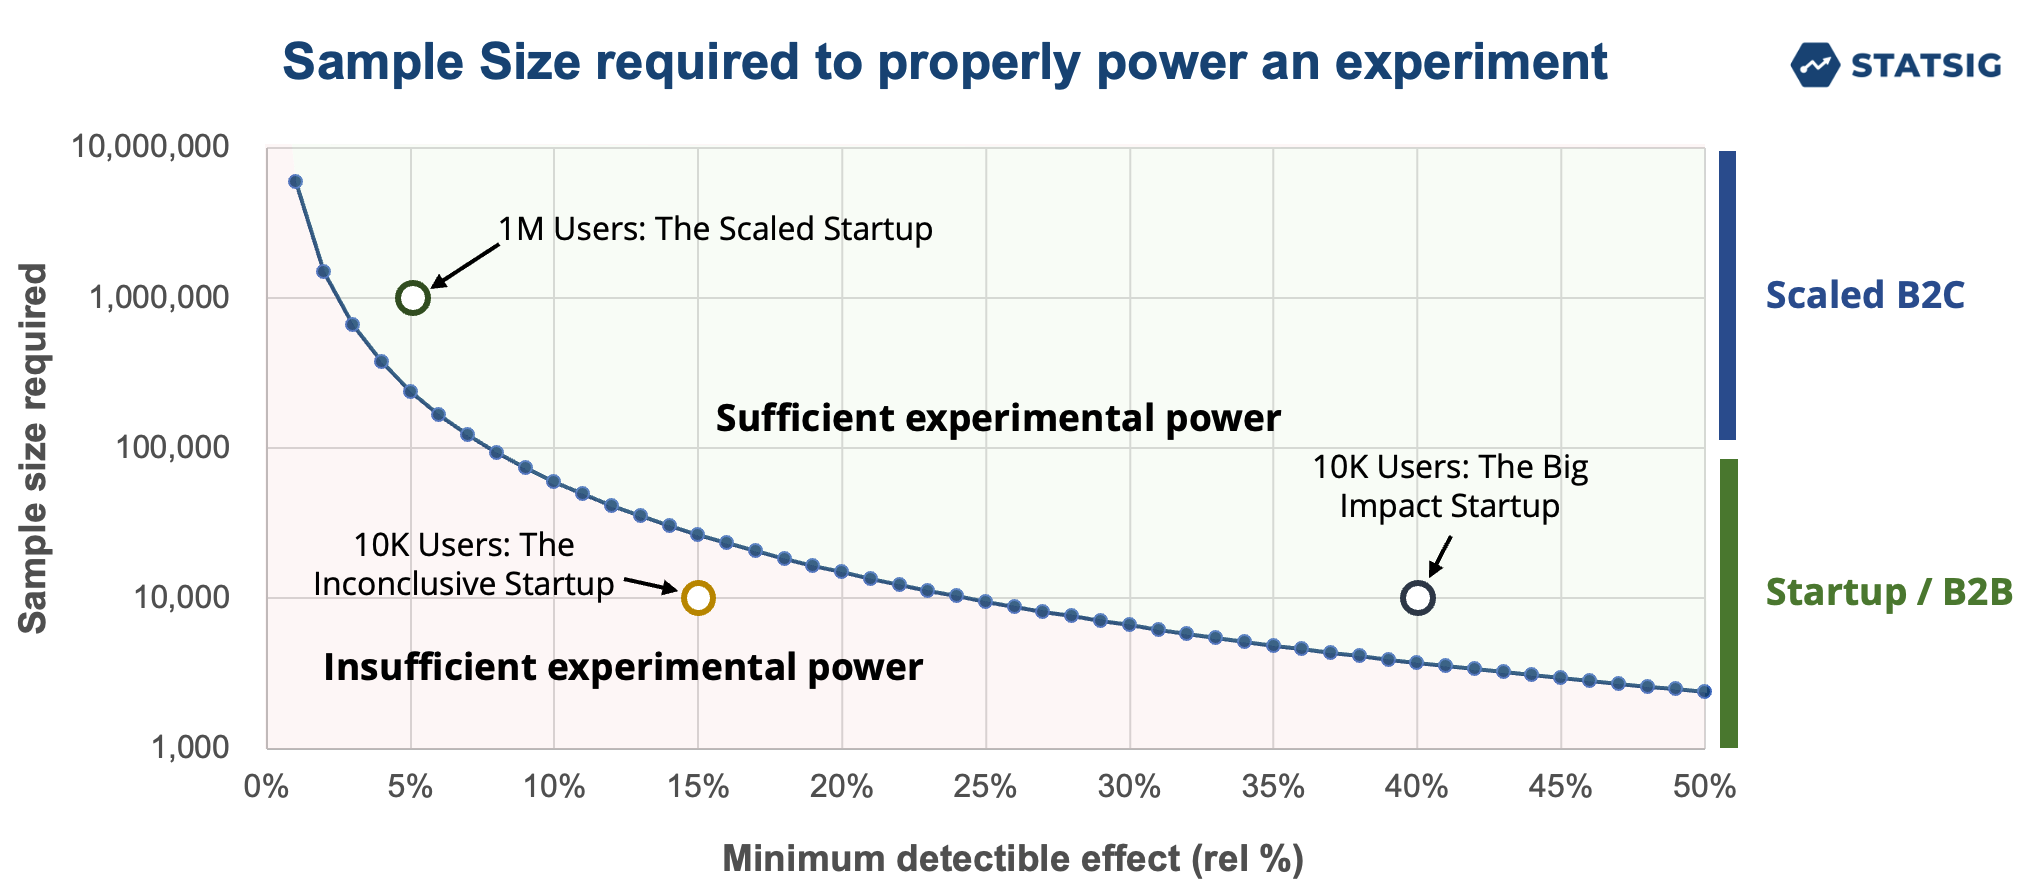
To illustrate our point, we'll use the chart below. It shows the relationship between minimal detectable effect (MDE) and the required sample size. The curve represents the number of samples needed to reliably detect an MDE as a statistically significant result.
Anything above the curve has sufficient experimental power to detect the experimental effect. Anything below the curve means you don't have enough experimental power.

To make this discussion more concrete, we've added three points to the chart representing three hypothetical eCommerce companies. However, it's worth noting that the laws of statistics apply to all companies, irrespective of business models including B2B.
Scenario: Each of these companies is launching a new AI chatbot in their mobile app. They hope it will increase the chance that someone adds an item to their cart and makes a purchase.
However, in product-based experiments, we care about long-term business metrics, not short-term novelty effects. Each company has set its objective to raise the 7-day repurchase rate (i.e., the percentage of users who return to the app and make another purchase within the next 7 days).
Let's also pretend that the chart above represents this metric, and the baseline repurchase rate is 5%. To measure the impact, they each ran an A/B test, exposing half of their users to the new feature (test) while leaving the other half alone (control).
The scaled startup (1M users)
First, we have a scaled startup with 1M weekly active users.
This startup launched its AI chatbot hoping it would increase convenience, provide better recommendations, and offer an enjoyable user experience. The startup believes this will combine to increase 7-day repurchase rates.
After running the experiment, they obtained statistically significant results! The new feature led to a 5% increase in the 7-day repurchase rate (from 5.0% to 5.25%, p-value <0.05). They can conclude that this new feature had a positive impact on this metric.
This is the size of company people link with experimentation. People associate large sample sizes with statistically significant results.
While it's true that big tech companies were early adopters of experimentation and have been vocal advocates, large sample sizes are just one prerequisite for statistical power. Another prerequisite, effect size, is actually far more important and strongly favors small companies.
The big impact startup (10k users)
Next up, we have a smaller startup with 10k weekly active users.
After testing their AI chatbot, they found a 40% increase in their 7-day repurchase rate, which rose from 5.0% to 7.0% for the test group. This improvement is a clear indication that the chatbot was a successful feature to implement, and one that they should continue to optimize.
This type of effect is typical for small startups. Unlike established businesses that focus on micro-optimization, startups cannot thrive on marginal improvements, such as a 0.2% uptick in click-through rates. Their sights are set on larger victories, such as a 40% surge in the adoption of a feature or a 15% boost in subscription rates.
These sorts of opportunities for big improvements are everywhere in a startup. They are working on unoptimized products and an MVP where many decisions were made arbitrarily and quickly.
Experimentation is a great way to revisit these decisions with a data-driven approach. In experimentation, effect size is far more important than sample size! This means startups actually have the upper hand in experimentation. Big effects = more powerful experiments.
But this isn’t the only way that experiments can be useful for a startup.
Statistical significance calculator

The inconclusive startup (10K users)
Finally, we have an early-stage startup with the same number of active users as our big impact startup.
They launched their AI feature and noticed a 10% increase in 7-day repurchase rates (5.0% to 5.5%). However, due to their limited sample size, the results were underpowered and inconclusive (such a result could plausibly be produced by random chance if there was no real difference).
While it might initially seem like a disappointment, this lack of a definitive result is actually a crucial insight. It reveals the limits of their current knowledge about the feature's impact, and provides an opportunity to revisit the hypothesis. They could do a few things with this insight:
If the impact is lower than they expected, they could commit to trying bigger, bolder ideas to see Stat-Sig impact
If the impact is what they expected, they could launch to more users (or wait until they have more users)
If the impact is lower than they expected, they can figure out what’s not working and try to refine the feature to increase impact. By cutting the results by various user dimensions, they might be able to find interesting results (e.g., lower latency improves the outcome), fix the problem, and ship an update
The valuable lesson here is that experimentation is not just beneficial when it confirms or refutes your hypothesis, but also when it highlights what you don't know or can't conclusively determine.
Again, this doesn't mean that every experiment will be inconclusive for Company C. Given that they're small and nimble, it's likely that their next feature launch will produce a sizable effect that yields statistically significant results. Soon enough, they’ll become the big impact startup.
Experimentation for small businesses

Taking action
These scenarios teach us a few valuable lessons:
Experimentation works for companies of all sizes.
Smaller companies are already hunting for big wins, and experimentation fits well into this strategy.
There’s still value in experiments that don’t succeed.
If you’re a small company, there’s no reason to wait to start experimenting.
Get started now!


