Products
Solutions
Resources


A Comprehensive Guide to Statistical Significance
Statistical significance is a way to assess reliability of results.
Statistical significance serves to help determine whether the relationship between variables is real or simply coincidental.
At the heart of statistical significance lies the concept of p-values. A p-value represents the probability of obtaining results as extreme as the observed results if the null hypothesis (the idea that there's no real effect or difference) is true. The lower the p-value, the more confident you can be that your results are meaningful.
Understanding statistical significance is crucial for making sound decisions based on data. In scientific research, it helps validate findings and ensures that conclusions are trustworthy. Businesses rely on statistical significance to guide product development, optimize user experiences, and maximize revenue. Understanding and applying this concept is essential for data-driven decision-making.
Some common applications of statistical significance include:
A/B testing to compare different versions of a website or app
Evaluating the effectiveness of a new drug in clinical trials
Analyzing customer behavior to inform marketing strategies
Assessing the impact of product features on user engagement
By grasping the fundamentals of statistical significance, you can harness the power of data to drive meaningful insights and actions.
Related reading: CUPED explained
Calculating statistical significance
Statistical significance is a crucial concept in data-driven decision making. It helps you judge whether the observed differences between groups are unlikely to have occurred just by chance. Here's a step-by-step guide to calculating statistical significance:
Formulating hypotheses
Begin by formulating a null hypothesis (H0) and an alternative hypothesis (H1). The null hypothesis states that there is no significant difference between the groups being compared. The alternative hypothesis suggests that there is a meaningful difference (i.e., difference above a threshold that you define).
Choosing significance level
Select a significance level (α) that aligns with your research objectives. Commonly used values are 0.05 and 0.01, indicating a 5% and 1% chance of rejecting the null hypothesis when it's true, respectively.
Collecting and analyzing data
Gather data from the groups you're comparing. Use appropriate statistical tests based on your data type and distribution:
For comparing means of two groups, use a t-test: Compute the statistic:

Where X̄, Sa and Na denote the sample mean, sample standard deviation, and sample size for group A (control), and X̄b, Sb and Nb are the corresponding values for group B (treatment). Under the null hypothesis, T follows a Student’s t-distribution with Na+Nb-1 degrees of freedom.
For comparing proportions, employ a Z-test: Compute the statistic:

Where Pa and Na are the observed proportion and sample size of group A (control), Pb and Nb are the corresponding values for group B (treatment), and P0 = (NbPb+NaPa)/(Nb+Na). You can also employ a chi-square test, although this test yields results that are not as easy to interpret as the first.
For comparing means of three or more groups, use Multiple Hypothesis Testing
These tests generate p-values, which represent the probability of obtaining the observed results if the null hypothesis is true.
Interpreting p-values
Compare the calculated p-value with your chosen significance level. If the p-value is less than or equal to α, reject the null hypothesis in favor of the alternative hypothesis. This indicates that the observed differences are statistically significant.
Contextualizing results
Interpret the results within the context of your experiment. Statistical significance suggests the presence of a meaningful effect, enabling you to make informed decisions based on reliable data. However, always consider the practical relevance of the findings.
When explaining statistical significance, it's essential to emphasize its role in separating genuine effects from random chance. By following these steps and choosing appropriate tests, you can confidently determine the significance of your experimental results.
Interpreting p-values and confidence intervals
P-values represent the probability of observing results as extreme as those measured, assuming the null hypothesis is true. A smaller p-value suggests stronger evidence against the null hypothesis.
However, p-values are often misinterpreted. They do not indicate the probability that the null hypothesis is true or false. Instead, they help determine how likely it is that results as extreme as those observed show up under the null hypothesis.
To avoid misinterpretation, consider p-values alongside other factors like sample size and effect size. As the sample size increases, even smaller effect sizes can yield p-values below the significance level. Conversely, when the effect size is large, a smaller sample size is sufficient to produce a sufficiently low p-value.
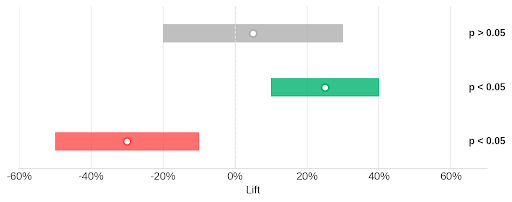
Confidence intervals provide additional context by estimating the range of values likely to contain the true population parameter. They complement p-values in explaining statistical significance.
Confidence intervals are typically expressed as a percentage, such as 95%. This means that if the study were repeated multiple times, 95% of the intervals would contain the true population parameter (each parameter has a different formula for its confidence intervals). Wider intervals indicate greater uncertainty, while narrower intervals suggest more precise estimates.
When interpreting p-values and confidence intervals, consider the practical significance of the results. A statistically significant finding may not always be practically meaningful. Assess the magnitude of the effect and its relevance to the research question.
Remember that p-values and confidence intervals are tools for making informed decisions based on data. They help quantify the strength of evidence and the uncertainty surrounding estimates. Use them in conjunction with subject-matter expertise and critical thinking to draw meaningful conclusions.
Common misconceptions about p-values
One common misconception is that a p-value represents the probability that the null hypothesis is true. This is incorrect. P-values indicate the probability of observing results as extreme as those measured, assuming the null hypothesis is true.
Another misconception is that a small p-value guarantees the alternative hypothesis is true. While a small p-value provides evidence against the null hypothesis, it does not prove the alternative hypothesis with certainty. Other factors, such as study design and confounding variables, should be considered. When the p-value falls below the significance level even though the null hypothesis is actually true, this results in what is called a Type I error.
Some believe that a non-significant p-value (e.g., p > 0.05) means the null hypothesis is true. However, failing to reject the null hypothesis does not necessarily mean it is true. It simply means there is insufficient evidence to reject it based on the available data. this results in what is called a Type II error.
To avoid these misconceptions:
Understand that p-values are conditional probabilities, not absolute measures of truth.
Consider p-values in the context of the study design, sample size, and effect size.
Interpret non-significant results cautiously, as they may be due to insufficient power or other factors.
Use confidence intervals to provide additional information about the precision of estimates.
By being aware of these misconceptions and taking steps to avoid them, you can ensure a more accurate interpretation of p-values and their role in explaining statistical significance.
Questions?

Factors affecting statistical significance
Sample size is a crucial factor in determining statistical significance. Larger sample sizes increase —the ability to detect genuine effects. With more data points, you can identify smaller differences between groups.
Effect size refers to the magnitude of the difference between groups. While statistical significance indicates the reliability of an effect, practical significance depends on the effect size. A statistically significant result with a small effect size may not be meaningful in real-world applications.
Multiple comparisons occur when you conduct several statistical tests simultaneously. Each test carries a small risk of a false positive (Type I error). As the number of tests increases, so does the likelihood of observing a significant result by chance. Techniques like the Bonferroni correction adjust the significance level to account for multiple comparisons, reducing the risk of Type I errors.
Variability also impacts statistical significance. High variability makes it harder to detect genuine differences between groups. Techniques like standardization or blocking can help reduce variability and increase the precision of your estimates.
Outliers can skew results and affect statistical significance. Identifying and handling outliers appropriately is crucial for accurate analysis. Techniques like Winsorization or trimming can help mitigate the impact of extreme values.
Confounding variables can obscure the true relationship between variables of interest. Failing to account for confounding factors can lead to misleading conclusions about statistical significance. Randomization should solve this problem. If proper randomization is impossible or impractical, controlling for known confounders can help isolate the effect of interest.
Understanding these factors is essential when interpreting results. By considering sample size, effect size, multiple comparisons, variability, outliers, and confounding variables, you can make informed decisions based on reliable and meaningful results. Careful experimental design and appropriate statistical techniques ensure that your conclusions are robust and applicable in real-world scenarios.
Best practices for reporting statistical significance
When presenting results in academic or business contexts, clarity and transparency are crucial. Provide a concise overview of the study design, sample size, and statistical methods used. Include the specific statistical test, the p-value, and the significance level (α).
Be transparent about any limitations or potential confounding factors in your study. Discuss how these might impact the interpretation of the results. Acknowledge any assumptions made in the analysis and their potential influence on the findings.
While statistical significance is important, it's not the only consideration in decision-making. Practical significance, such as the magnitude of the effect or its real-world implications, should also be weighed. A statistically significant result may not always warrant action if the practical impact is minimal.
When explaining statistical significance to non-technical audiences, focus on the key takeaways rather than delving into technical details. Use simple language and relatable examples to convey the importance and implications of the findings. Visual aids like graphs or charts can help illustrate the results effectively.
In business settings, frame the results in terms of their potential impact on the company's goals or bottom line. Highlight how the findings can inform strategic decisions or drive improvements in products or processes. Provide actionable recommendations based on the statistical evidence.
Remember that statistical significance is just one piece of the puzzle. It should be considered alongside other relevant factors, such as cost, feasibility, and alignment with organizational values. Use statistical significance as a tool to guide decision-making, but not as the sole determinant.
By following these best practices when reporting statistical significance, you can ensure that your findings are communicated effectively and used to drive meaningful change in both academic and business contexts.
Request a demo
