Products
Solutions
Resources
Product Updates
Meta-analysis/Experiment Timeline View
We're rolling out the first in a series of views that enable meta-analysis across your corpus of experiments. This view lets you to filter down to experiments a team has run. At a glance you can answer questions like
What experiments are running now?
When are they expected to end?
What % of experiments ship Control vs Test?
What is the typical duration?
Do experiments run for their planned duration - or much longer or shorter?
Do experiments impact key business metrics - or only shallow or team level metrics?
How much do they impact key business metrics?
It is rolling out now to experimenters that have expressed interest in or have offered feedback on meta-analysis needs. Reach out in Slack if this is an area of interest; we're adding more over the summer and would love to hear from you! It is homed under the Insights tab in the left navigation.

SDK events are now hourly in WHN
If you choose to use the Statsig SDKs to log custom events (user actions like e.g. clicks, searches or page loads), we now batch and write them to your warehouse hourly (instead of daily). This is helpful when you've just launched an experiment and want to preview data to see if it is working (or causing crashes).
If you use your own telemetry pipeline to capture events, this has no impact on you.
Exposures
If you use the Statsig SDKs for assignment, we batch, dedupe and write exposure information to your warehouse daily.
When you load Pulse (experiment scorecard), we perform a just-in-time update of exposures for the current day so you're looking at current results. This typically captures exposures as recent as ~15m old.

Saved Queries in Metrics Explorer
We’re excited to introduce a new feature in our Product Analytics product called Saved Queries. This update improves your insight gathering and exploration workflow by providing a lightweight way to save your analysis for later use, or share them with the whole team.
What’s New with Saved Queries
Previously, to leverage previous insights you've come to in Statsig product analytics, you had to bookmark the URL or save it to a dashboard. Now, with Saved Queries, you can preserve these insights more easily. This feature simplifies how you work with data, making it more straightforward to revisit and build upon your previous analyses.
How It Works
When you land in Metrics Explorer, our main product analytics surface, you start on an “Unsaved Exploration” and can immediately dive into user and product data. If you discover valuable insights, you can save the query directly, enabling you to access and refine your findings at any future point.
Personal and Published Queries
Saved Queries come in two types:
• Personal Queries: These are private and only accessible by you. You can save any number of insights that are particularly relevant to your ongoing projects.
• Published Queries: If your saved query could benefit the entire team, you can choose to publish it. Once published, these are available to everyone in the project through the Saved Query catalog in Metrics Explorer, enabling better collaboration and knowledge sharing across your team.
We believe that Saved Queries will streamline your analysis and exploration tasks, making it easier to manage and share important insights across your team.
We will start rolling out Saved Queries today. We look forward to seeing how saving queries makes building and sharing your insights easier!

💻 Web Analytics
Web Analytics makes it dead simple to track and watch key measures for your website.
Debuting on our suite of Javascript SDKs, Web Analytics auto-captures key user-generated events like page views, errors, page performance stats, clicks, and form submits. With each of these auto-captured events, we include key user and website page metadata, making advanced exploration easy out-of-the-box.
Once you’ve gotten up and running with Web Analytics, you can easily:
Explore your website’s engagement via Metrics Explorer
Look at your user engagement trends, via Statsig’s auto-generated suite of User Accounting metrics including DAU/ WAU/ MAU, stickiness, retention, etc.
Curate and share your own custom set of dashboards, applying custom filters and aggregations to your suite of auto-captured events
Read more in our docs & let us know if you have any feedback or questions!

🎯 Inline Targeting Criteria
Often, you may want to experiment on a specific group of people as defined by targeting criteria. To-date to accomplish this you’ve had to define a Feature Gate with your targeting criteria and then reference this Feature Gate from the experiment.
While this is useful if your targeting criteria is relatively common (and you’ll want to reuse it again in a future experiment or rollout), this can introduce extra configs and overhead if this targeting criteria is only serving the experiment in question.
We say- extra overhead and unnecessary configs cluttering up your catalog BE GONE!
Today, we’re starting to roll out the ability to define targeting criteria inline within your experiment setup. This will be accessible via the same entry point you can select an existing Feature Gate to target your experiment against (don’t worry, that capability isn’t going anywhere).
Read more in our docs here and don’t hesitate to reach out if you have any questions!

Stratified Sampling (for B2B experiments)
For B2B experiments on small sample sizes (or tests where a tail-end of power users drive a large portion of an overall metric value), randomization alone doesn't cut it. Your Control and Test groups may not be well balanced if your whales end up in either group.
This new Statsig feature meaningfully reduces false positive rates and makes your results more consistent and trustworthy. It tries a 100 different randomization salts and then compares the split between groups based on a metric or classification you provide to find the best balance. In our simulations, we see around a 50% decrease in the variance of reported results.
Read more about using the feature here, or learn more about how it works here. This is now rolling out on both Statsig Cloud and Warehouse Native on Pro and Enterprise tiers.

Tables as Metric Source
When we created Metric Sources, we supported arbitrary SQL queries to maximize flexibility. We've now added support for directly pointing to tables for when that's what you want.
Using tables directly is simpler and improves performance. We can be pick just the columns we need to operate on even when the table is very wide. Complex filters can be applied efficiently without your SQL engine first trying to materialize a CTE.
An added perk with using Tables as a Metric Source is being able to use formulae. You can apply simple SQL transforms to columns (e.g. convert from cents to dollars by dividing by 100) or alias them to make them more discoverable.
🥷🏼 Statsig ID Resolver
Ever pop into a Feature Gate to check if a user is overriden and are hit with a wall of long, cryptic IDs that mean absolutely nothing to you? Yep, we have too.
Introducing Statsig ID Resolver. Now you can host a mapping of IDs to real names (or any string, really) to make leveraging IDs easier throughout the Console.
To set up Statsig ID Resolver, navigate to “Settings” → “Project Settings” → “Integrations” and scroll all the way to the bottom to find “Statsig ID Resolver”. Check out our documentation for full instructions to get ID Resolver set up.

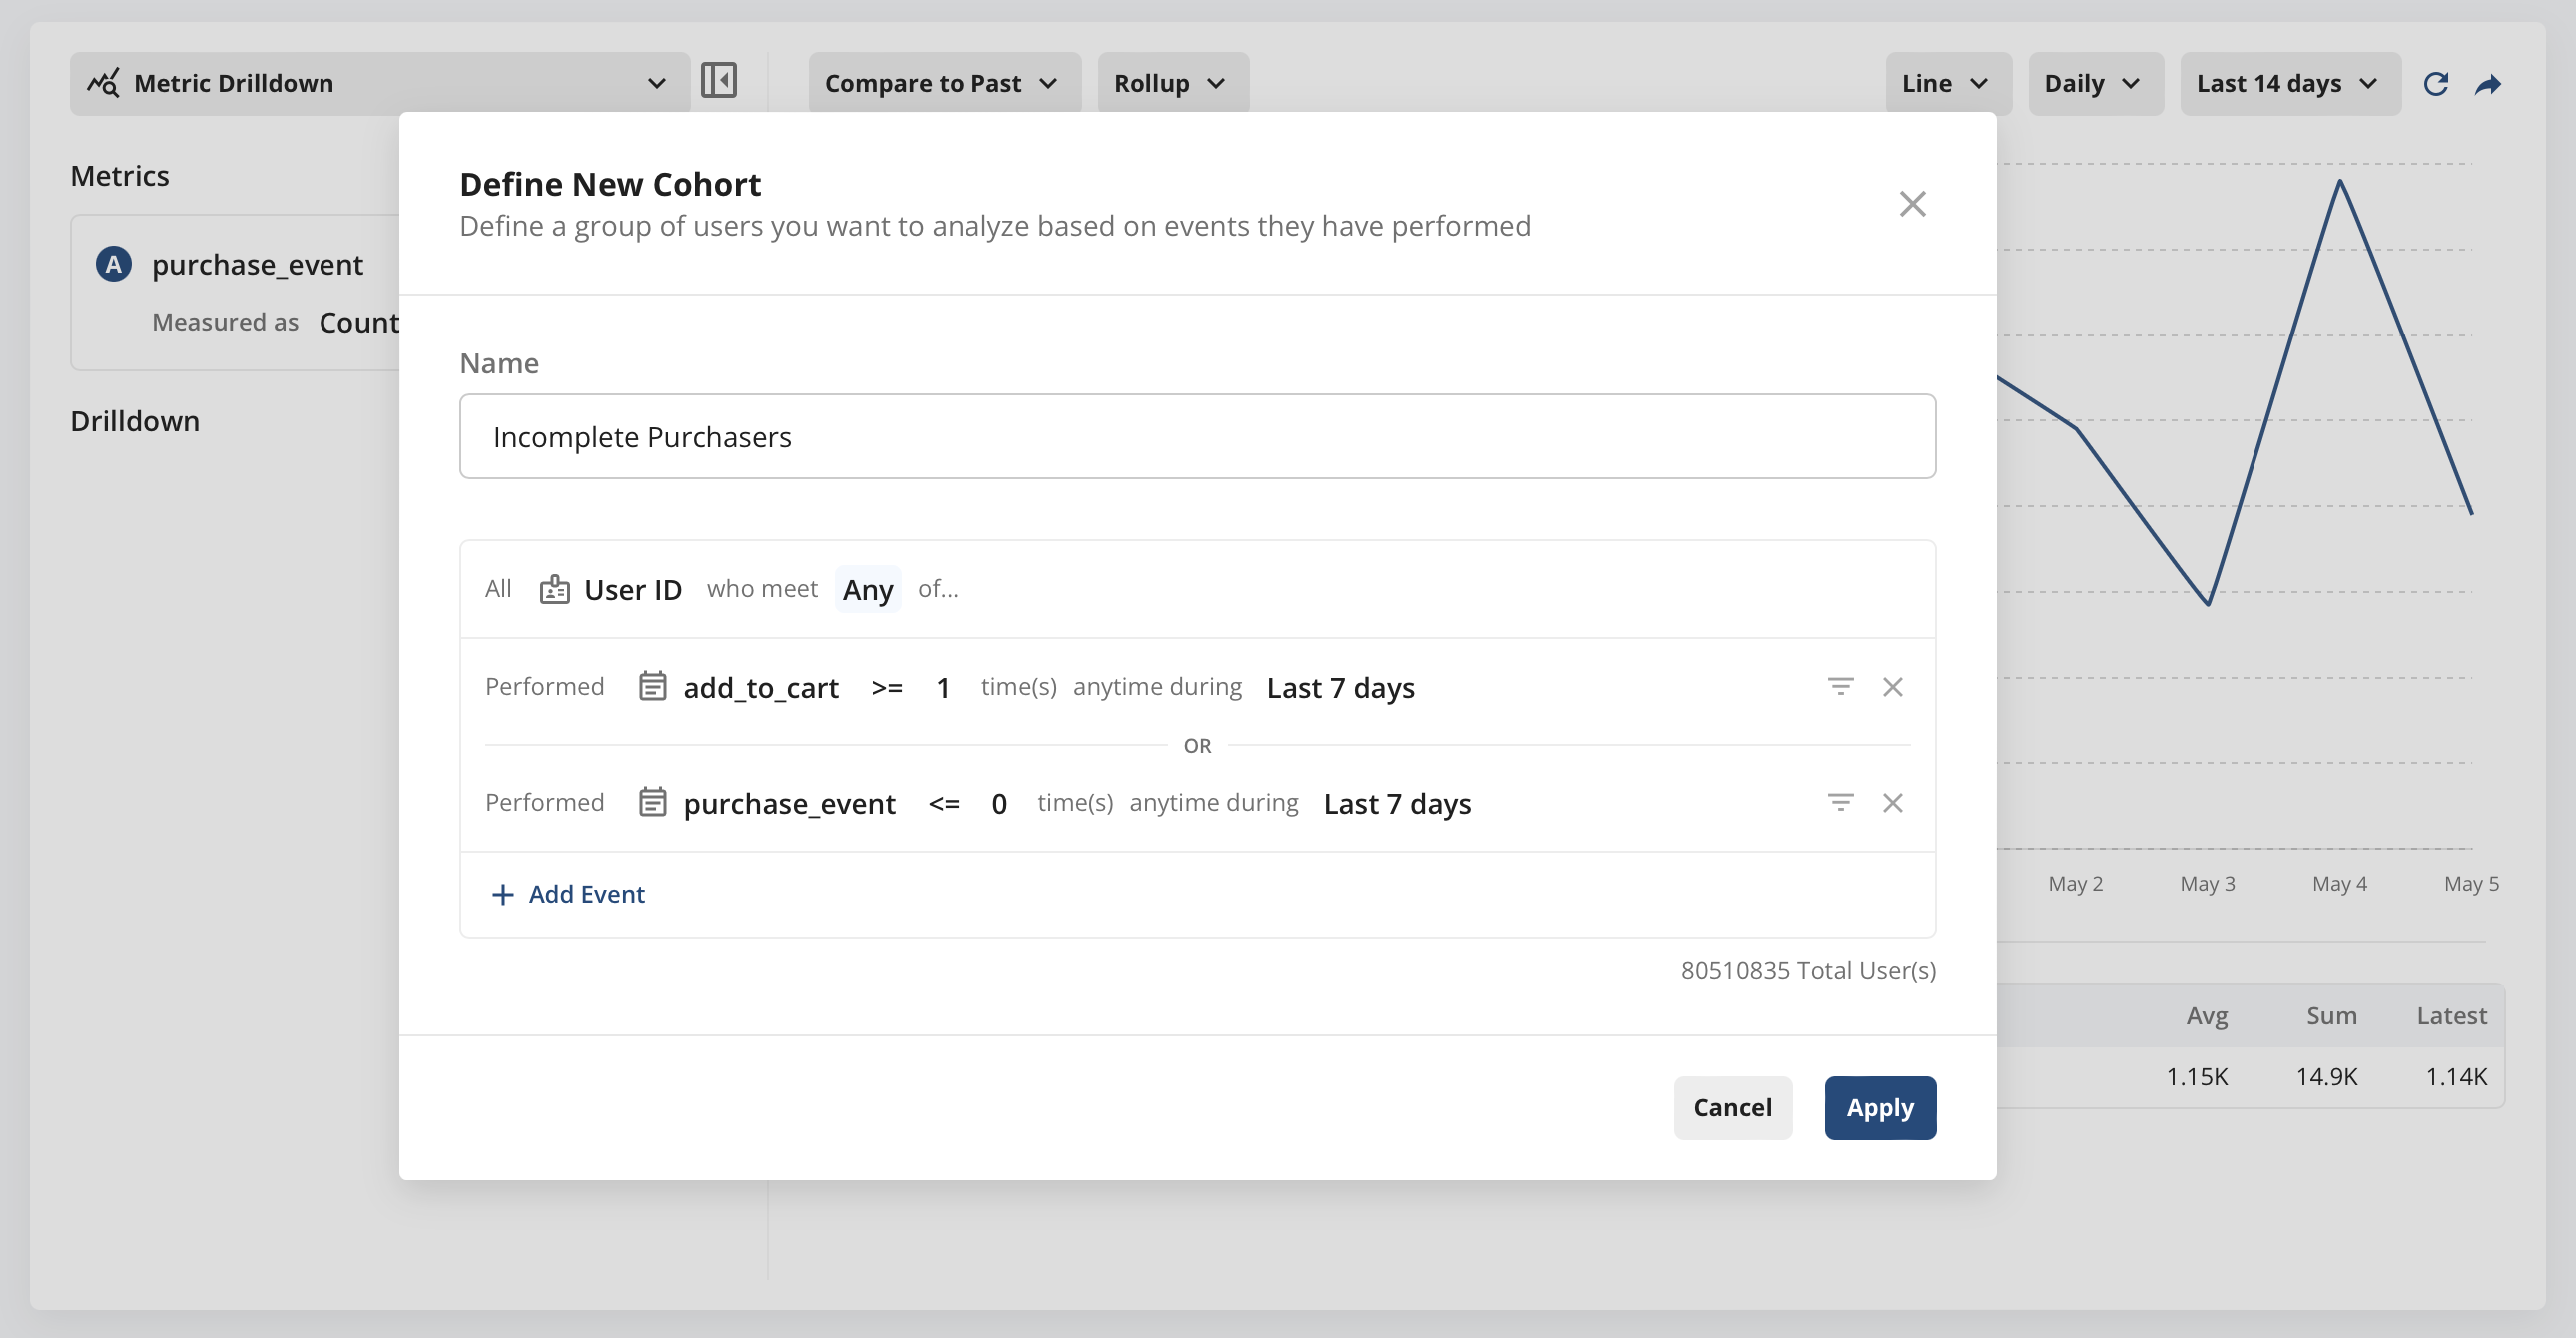
Multi-Event Cohorts
We are excited to introduce a new feature to product analytics in Statsig: Multi-Event Cohorts. This new feature allows you to define user cohorts based on multiple events, enabling the creation of highly specific and insightful user groups.
With Multi-Event Cohorts, you can now include users who have engaged in various combinations of activities, such as users who both completed a purchase and subscribed to a newsletter, or users who viewed a product but did not add it to their cart. This capability provides a powerful tool for dissecting user behaviors and understanding the different ways users interact with your product.
By utilizing Multi-Event Cohorts, you can craft more detailed and useful insights into user engagement, helping you to improve strategies for user retention and product development.
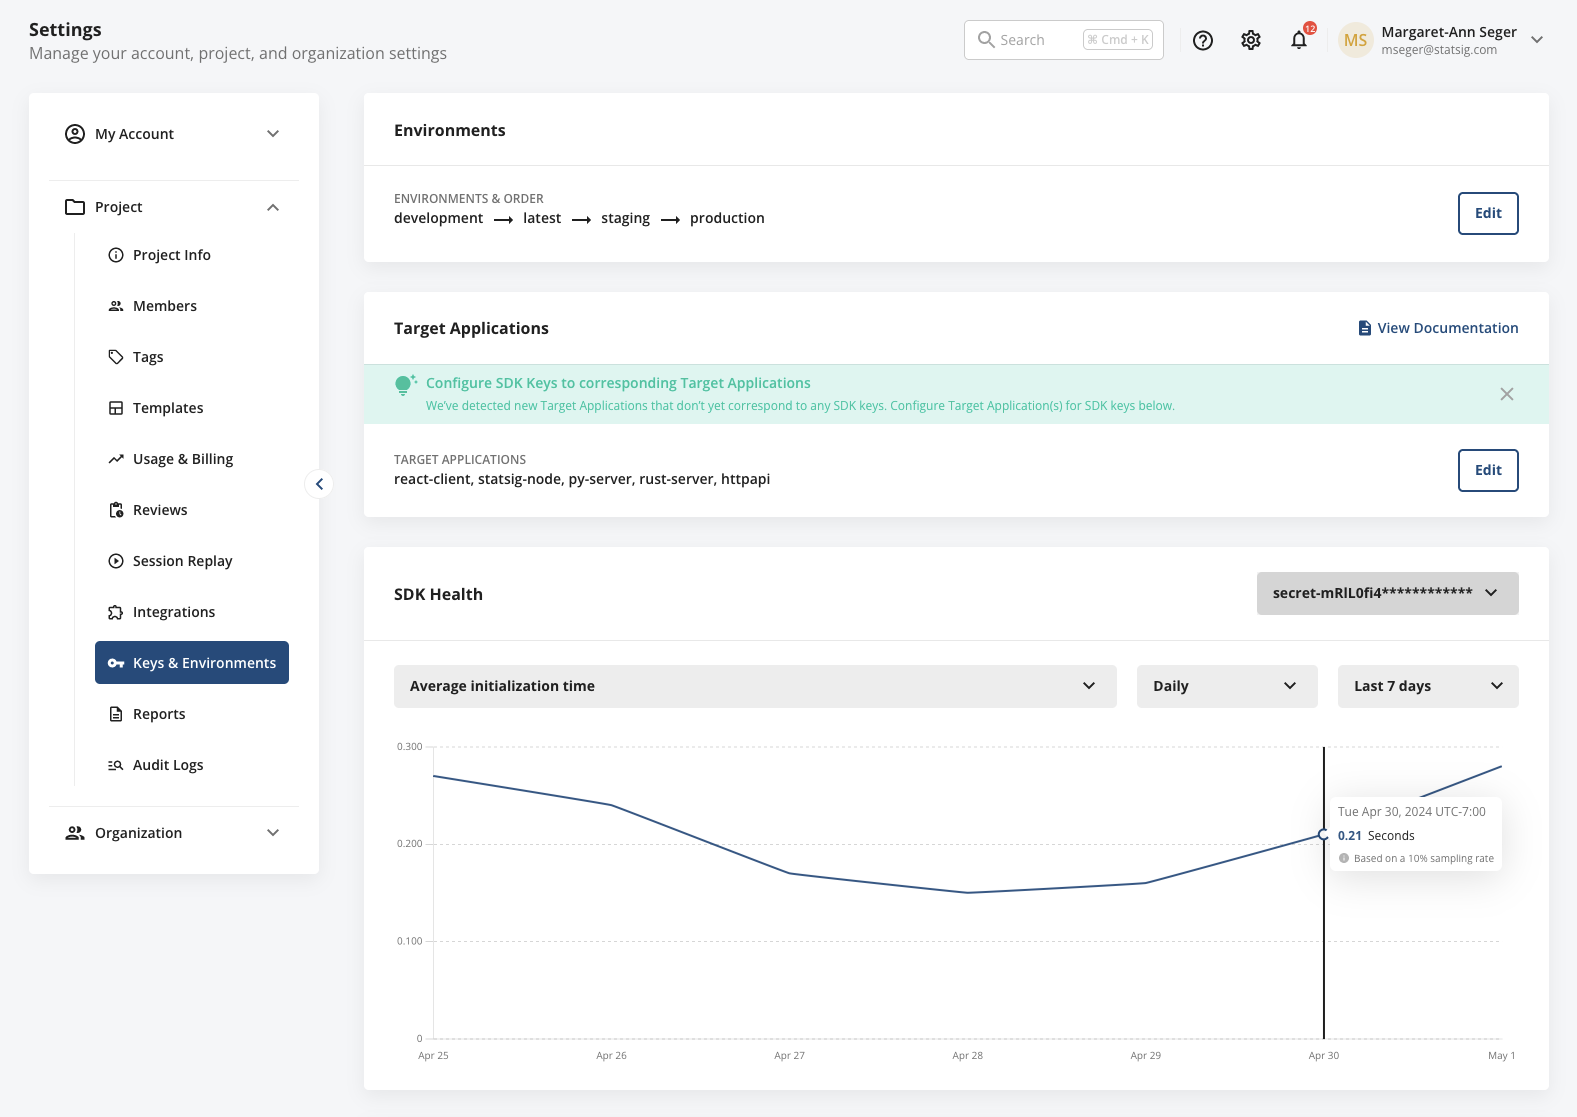
🫀 SDK Health Visibility
While the Statsig Console is the face of most customers’ experience with Statsig, much of the power of Statsig happens “behind the scenes” via Statsig’s SDKs. Today, we’re excited to unveil a set of SDK performance stats to enable customers to stay abreast of their SDK health, including:
Download config spec size
Success rate
Average initialization time
… with more stats coming soon!
These stats are accessible alongside your SDK keys in Settings → Project Settings → Keys & Environments and can be viewed hourly or daily, over any custom date range.