Products
Solutions
Resources

Feature flag tools are crucial for managing feature rollouts and experimentation, but finding the best option for different usage levels can be overwhelming.
To simplify the process, we’ve put together a spreadsheet comparing pricing, complete with all the formulas we used and any assumptions we made. Feel free to make a copy of the sheet and change the assumptions to match your company’s usage. We’d love your feedback on our approach!
The key takeaway? Statsig is the only tool that provides free feature flags for self-service companies at all stages.
While other platforms offer free tiers up to certain usage levels, they all cap out once you see notable scale in your user base.
Feature flag platform cost comparison
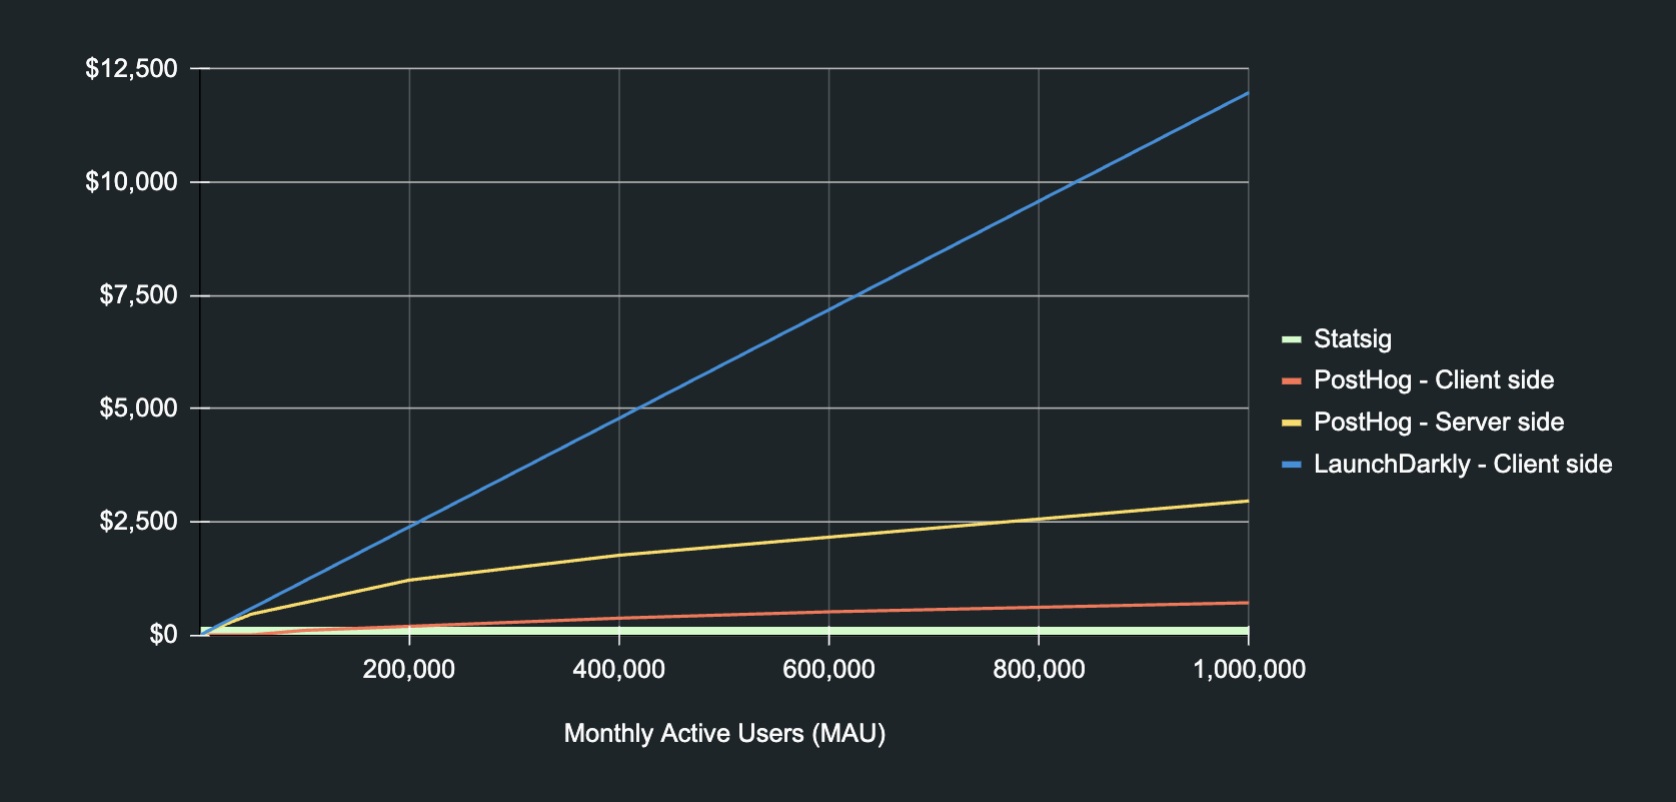
In our review, we evaluated several vendors using consistent assumptions. Below is a graph of the results:

Key insights:
Statsig offers the lowest pricing across all usage levels, with free gates for non-analytics use cases (i.e., if a gate is used for an A/B test).
Launch Darkly’s cost for client-side SDKs reaches the highest levels across all platforms after ~100k MAU.
PostHog client-side SDK costs stand as the second cheapest across feature flag platforms while still racking up hundreds of dollars for usage over 1M requests.
The free tiers of LaunchDarkly and PostHog are relatively limiting and tend to only hold for MAUs of <5000; upon achieving the usage levels of the free tier for these platforms, costs start to differentiate vastly at scale.
Assumptions about pricing
Feature flag platforms use different usage metrics to price their platforms, making it difficult to compare pricing models on an exact apples-to-apples basis.
Therefore, we made the following assumptions to create a comparable view of pricing across platforms. We are open to feedback on these assumptions!
We decided to use Monthly Active Users (MAU) as a standardized benchmark across platforms, given the feasibility of mapping most usage metrics leveraged for pricing feature flags to MAU.
The assumption of 20 sessions per MAU is made on the basis that each active user is assumed to have 20 unique sessions each month.
One request per session is used, given a standard 1:1 ratio for requests and sessions.
20 gates instrumented per MAU made on the assumption of using 20 gates in a given product.
50% of gates checked each session is used as a benchmark on the basis of users only triggering half of the gates in a given session.
One context (client-side users, devices, or organizations that encounter feature flags in a product within a month) per MAU given the close definition of the two.
Other considerations
When evaluating feature flag platforms, cost is just one factor to consider. Looking at additional capabilities such as flag lifecycle management, impact measurement/analyses, and environments available to manage flags for dev, staging, and prod is equally important.
Scalability and security are other important considerations. Choose a platform that can support high-traffic environments without latency issues and ensure it meets your security and compliance needs.
Closing thoughts
We encourage you to review the detailed methodology in this Google Sheet. If you have any questions, reach out here or shoot me an email!
And since our platform is the only offering that offers free feature flags, it's a great place to start. 😁
Get answers fast
