Products
Solutions
Resources


In the realm of business and marketing analytics, the funnel is a familiar concept.
There are many great tools for analyzing these—Mixpanel, Amplitude, and Statsig’s Metrics Explorer all have advanced funnel features to let you drill down into how users are moving through your product. Through funnel analysis, companies can understand where users fall off, helping them build better user experiences and ultimately drive business outcomes.
One weakness of many funnel analysis platforms, however, is how they integrate funnel metrics with experiments.
On most platforms, you can set up manual tagging and group funnel results by experiment groups, but it can be hard to get a clear, reproducible understanding of core user journeys in your product.
We’re going to jump into the details of this kind of analysis, and how Statsig Warehouse Native makes this kind of analysis easy to do:
Advantages of experimental funnel metrics
Granularity in user-level metrics: Traditional user metrics are valuable, but they can miss nuance and help in understanding causal pathways since they lack the intricacies of the user's actual journey. Funnel metrics, on the other hand, break down a user journey into discrete steps, providing a clear view of where conversions or drop-offs occur and letting you map that back to product changes you made.
Ordering: One of the key features of funnel metrics is their respect for sequence. They are constructed to recognize events that happen in a predetermined order. This means they can accurately gauge the success of a product change on impacting a user's journey, since they help understand the relationship between steps.
Potential weaknesses of funnel metrics
Not a standalone metric: As insightful as funnel metrics can be, they’re generally not a great evaluation in criteria. Since they are scoped to users who started a funnel, the impact on other users will narrow and bias your experiment results. Funnels should be used as explanatory metrics in conjunction with topline evaluation criteria like total conversions.
Complexity in setup: Establishing sophisticated funnel metrics, particularly at session levels, can be intricate and demanding in terms of time and resources. Additionally, different approaches or different settings can yield dramatically different results. Having a reusable definition helps a lot here
Inherent ratio metrics: Funnel metrics are, at their core, ratio metrics. This means that they might be underpowered in certain scenarios, and mix shift can make interpretation tricky
Risk of mix shift: If there's an increase at the top of the funnel but a subsequent decline in the average quality of that input, it can lead to confusing results in analysis. This phenomenon, known as mix shift or Simpson’s paradox, is where the composition of the users changes and makes the overall outcome move in counter-intuitive ways
Core funnel features
Ordering in analysis: A core principle of effective funnel analysis is its respect for event ordering. For a conversion to be valid, all preceding events in the funnel should have been completed in their respective order. This ensures the integrity and accuracy of the data.
Visibility and statistical analysis: In addition to tracking conversion between steps, a good experimental funnel analysis provides clear visualization and rigor around what changes an intervention caused, and statistical inference around the observed deltas
Session-level analysis: Funnels can be user or session level. A user funnel is appropriate for a question like “Did this change make more users finish our buyflow and purchase?”. A session-level funnel is appropriate for a question like “Did this change make our checkout flow convert better?”, since you would want to measure multiple different funnels from the same user if they went through the checkout flow multiple times. Being able to choose the correct granularity is invaluable, especially for platforms with dynamic user pathways such as E-commerce or booking sites.
Clear communication with named steps: Assigning specific names and signficiance to each step of the funnel is vital. It guarantees that individuals across teams, irrespective of their technical expertise, can understand and discuss the funnel with clarity. This paves the way for faster decision-making and more effective interventions.
Join the Slack community

Funnels analysis in action
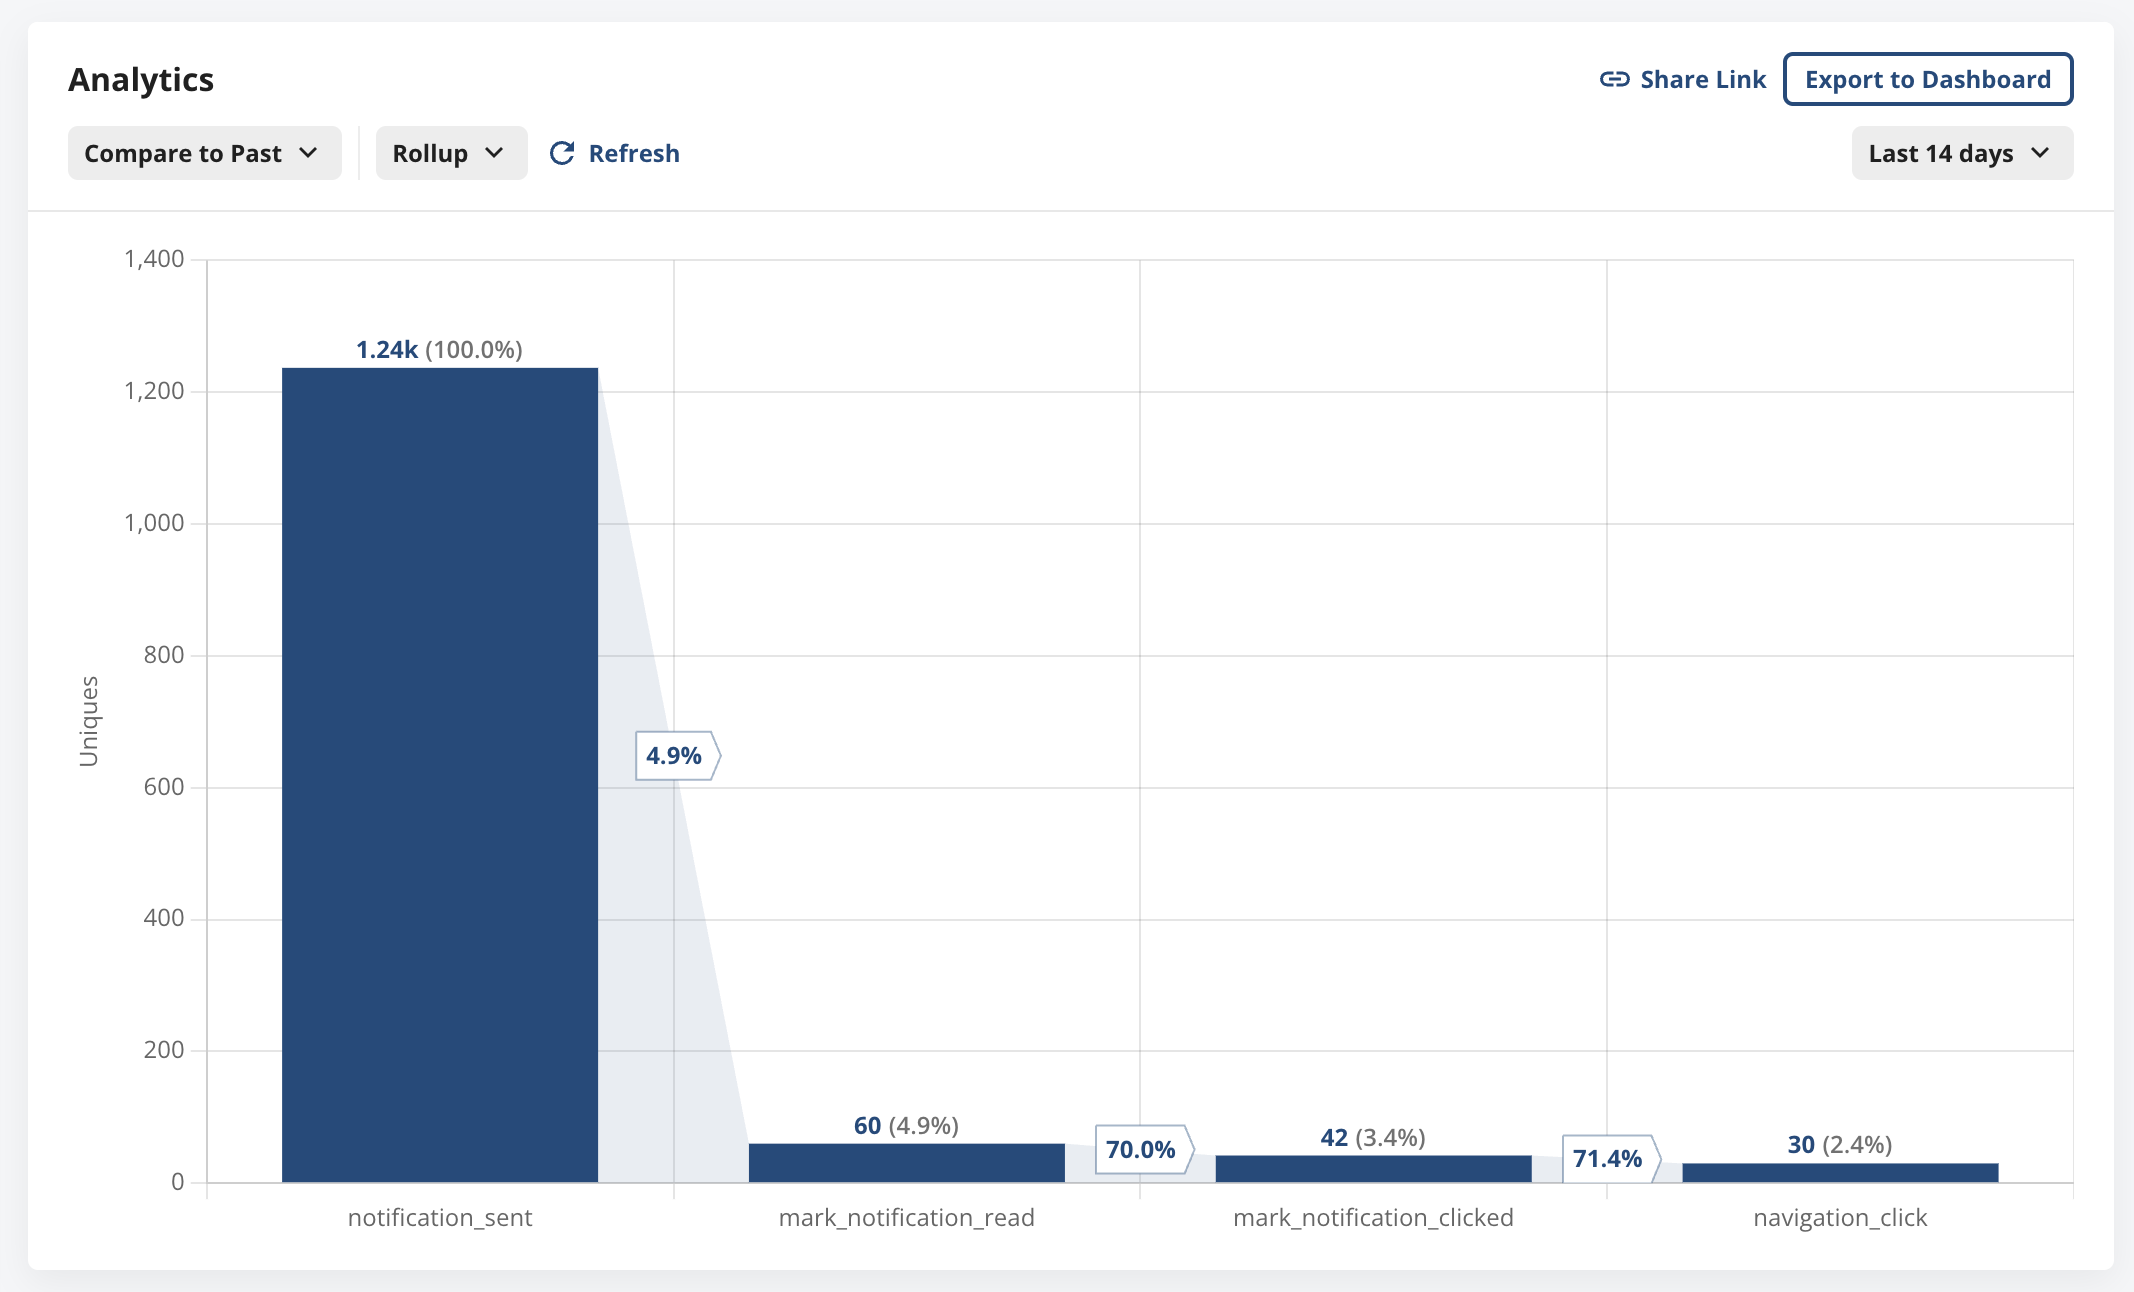
A funnel consists of a series of steps that a user must perform in order. Outside of an experimental context, results are generally measured in terms of the users per step in conjunction with the conversion rate between each step—optionally broken down by user or event properties.
The funnel below is from Statsig’s Metrics Explorer and shows a representative funnel analysis from sending notifications to users entering and navigating within an app. You can see the users who performed each action, as well as the step-wise conversion. At a glance, you can see that the big drop is from notification sends to notification reads, and the conversion from read to click is quite high.
In the experimental context, the focus should be on how an experiment changed funnel conversion.
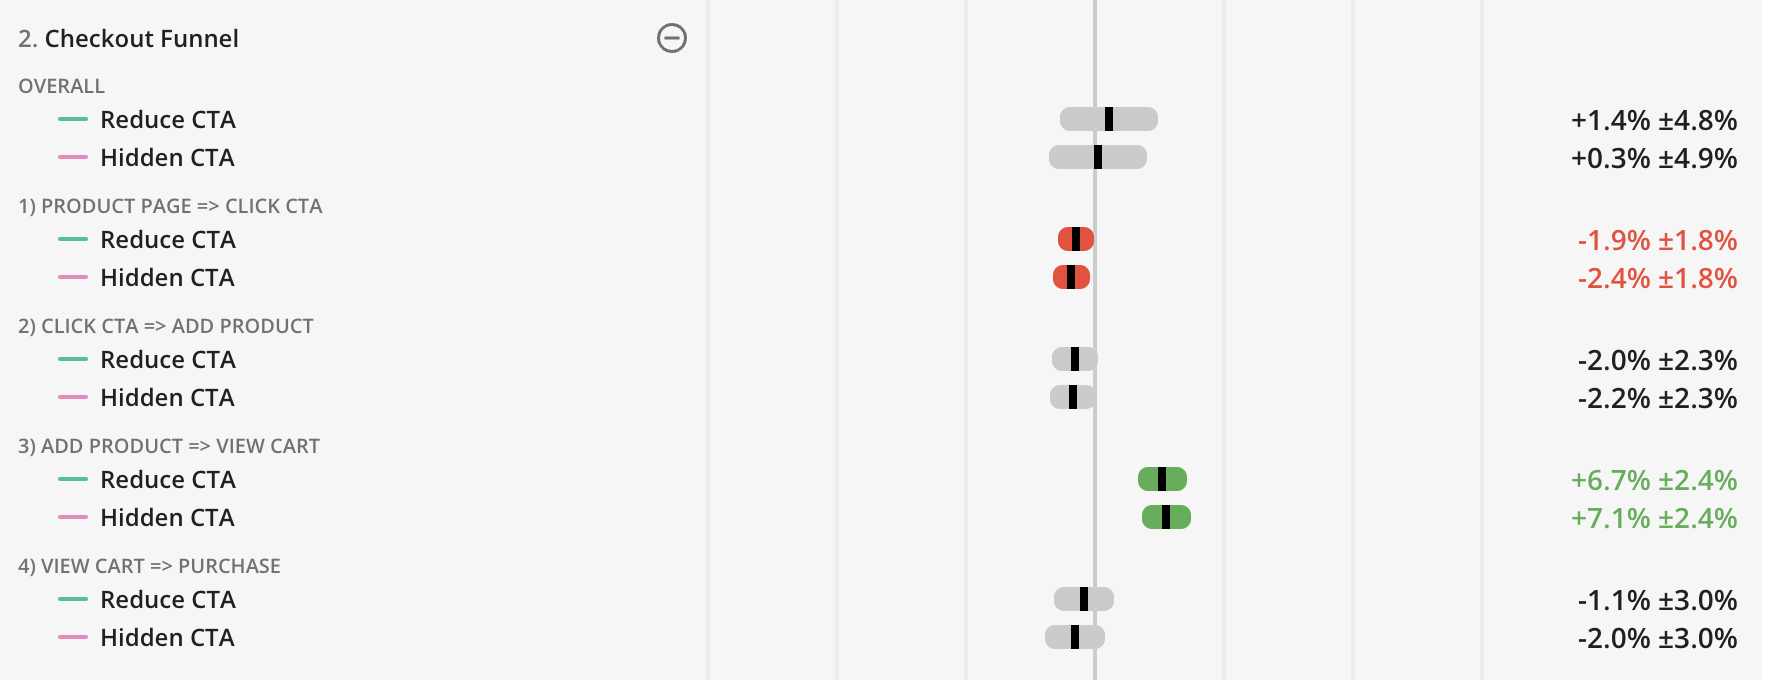
The view below comes from Statsig’s Pulse result page. This is an experiment with two variants—one that reduces the prominence of a Call To Action (CTA) button, and one that hides the CTA.
In an analysis without a funnel metric, we’d probably measure the total purchases and total CTA clicks. We would see that clicks decreased in a statistically significant way, but purchases didn’t—while we can infer some of what happened, it’s a bit fuzzy.
In this funnel analysis, we can see at a glance that both variants decreased CTA clicks for users viewing the product page, but the users that did click had a much higher conversion of viewing their cart after adding a product.
The neutral overall impact is due to these opposing behavioral impacts, and we have a much richer understanding of how this impacted user behavior.
Always be optimizing
Funnel metrics, by combining detailed insights and an intuitive definition, provide you with a powerful tool to optimize your platforms. While they shouldn’t singularly drive decisions, funnels are a valuable tool for understanding the feature-level impact on improving signup, notification, and checkout flows.
When harnessed effectively and interpreted within the broader business context, funnels can play a pivotal role in shaping strategic initiatives and product owners’ understanding of how users are engaging with their product.
Request a demo
