Products
Solutions
Resources

Some companies measure everything.
When you think of “world-class growth teams” you probably think of companies like Facebook, Uber, Slack, and Calendly. We’re talking companies that maniacally check core metrics—the masters of experimentation-driven product development.
There are many ingredients that go into building industry-leading growth teams, but the good news is that it’s more science than art. There’s a common playbook among the best growth teams, and it starts with one common thread: a focus on data-driven metrics.
Unfortunately, knowing which metrics to track (let alone the methodology behind defining these metrics correctly) can be intimidating for companies that are new to building a dedicated growth team.
That’s where Statsig comes in! We’ve built a whole suite of out-of-the-box user accounting metrics that make it easy for growth teams to measure and optimize user behavior.
How Statsig’s user accounting metrics work
As soon as you integrate Statsig’s SDK into your product and start logging events, Statsig’s suite of user accounting metrics will light up. These metrics auto-compute daily based on “trigger” events that you can define in the product.
Our suite of user accounting metrics includes:
DAU/ WAU/ MAU
New Users
Daily/ Weekly/ Monthly User Stickiness
Daily/ Weekly Retention Triangle Charts
Last 7-day/ 14-day/ 28-day active users
…and more (see the full list)
How user accounting metrics help your team
Calculating daily/ weekly/ monthly active users can teach your team a number of things that make the business more effective.
Get a feel for the direction of your business: Simply knowing your top-line DAU/ WAU/ MAU can inform your growth strategy and tell you whether your product is growing, stagnant, or shrinking. What % of your total user base is “active” at any given time? These are numbers that great growth teams know off the top of their head, and track meticulously.
Understand the relative engagement of your customer base: Is your product a daily, weekly, or monthly use case? If most of your customers are using your product monthly, how do you expand your product offering to drive a more frequent use case (move users from MAU → WAU → DAU)?
Understand usage seasonality: How do your DAU/ WAU/ MAU trend over time? Do DAU become WAU or WAU become MAU at certain times of the year? For example, here at Statsig, we observed a general engagement mix-shift over the holidays (we’re an Enterprise SaaS product, so this makes sense- people just aren’t at work shipping features and launching experiments between Christmas and New Year!) Now we know to expect this around the holidays each year.
These are just the first level of insights you’ll get from user accounting metrics, but for many teams, these can be transformative.
If you’re ready to get started, the first thing you’ll need to do is define what it means to be an active user—which can be a tricky exercise. Fortunately, Statsig makes it easy.
Defining an active user
How you define an “active user” matters.
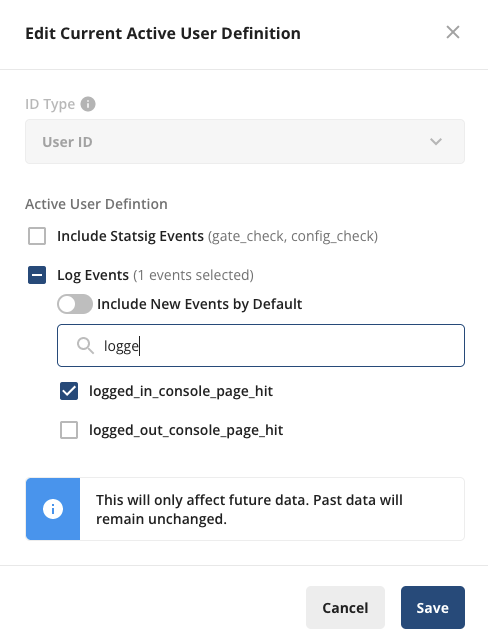
Is it logging in and landing on your app’s home page? Is it making a purchase? Is it browsing a feed for more than 20 seconds? The exact definition depends on your business.
Within Statsig, we use any login as the definition of an active user. We have a lot of users who come into our console to check on metrics or experiment results, so users can see value from a session without taking any additional actions.
For a product that’s more focused on engagement (for example, a game or chat app), you’d probably look to define an active user based on a downstream action (e.g., starting a game session, or starting a chat).
Unfortunately, Statsig can’t make that decision on which metric to use for you.
That said, we do make the calculation easy.
All you have to do to define an active user is to specify the “trigger” events that qualify a user as an active user, which we will use in all of our user accounting calculations.
Seeing who sticks around
So you’ve defined active users, and know how many people are using your app in a given day, week, or month. What’s next?
Seeing who sticks around!
Stickiness helps you determine whether people are coming back to your app on subsequent days/ weeks/ months. While DAU/ WAU/ MAU help you determine what % of your base are active at any given time, it doesn’t tell you anything about who your active users are. Are your active users the same active users coming back every single week? Or a totally different subset of your user population? Stickiness helps bridge this gap.
Stickiness metrics can provide second-order insights into the efficacy of your application, and the loyalty of your user base. Some things you might learn:
How you’re delivering ongoing value: If you’re seeing the same users come back month-over-month or week-over-week, then something you’re doing is really working for those customers! By isolating these cohorts of sticky users and digging into the way they’re using your product, you learn how to replicate the value they see across more users
Which re-engagement tactics work: Let’s say you’re trying to re-engage churned users and you decide to send a push notification with an incentive attached. You observe that you’ve successfully driven users into the app and your DAU goes up, but you want to see whether those users come back the next day as well. Daily User Stickiness would help you achieve this - and scale re-engagement tactics across all churned customers.
Long-haul users: tracking retention & engagement
Stickiness metrics are great for finding effective tactics to onboard and re-engage users, but for longer-term analyses, you’ll want to explore deeper retention and engagement metrics.
Monitoring and ensuring healthy long-term retention is critical to growing a product. It doesn’t matter how many new users you add—if you can’t retain them, you won’t have a viable product. Retention is often seen as the best proxy for true “product/ market fit”.
There are a number of ways to measure retention. Statsig offers a few out-of-the-box options in the Statsig Console, including:
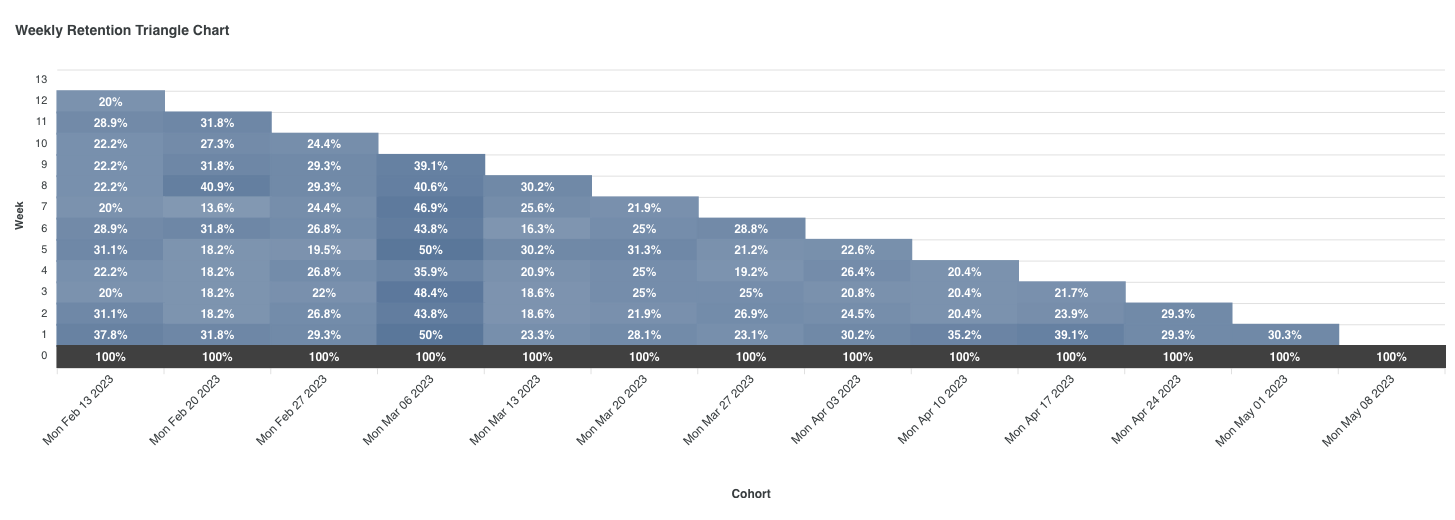
Triangle Charts: Triangle charts were popularized in the early innings of Facebook’s Growth team, by OG growth pioneer Alex Schultz. They’re a way to visualize retention at a cohort level. Each new joining cohort is represented by a bar in the chart with their relative retention at each day/ week post-joining accruing vertically (hence why this is called a “triangle chart:” the shape naturally becomes a triangle as early joining cohorts have the most historical data).
L-ness: L-ness is a measure of how engaged your user base has been in the last x days. For example, L7 measures the average number of days a user is active in the last 7 days. For any given user, they can have an L7 value of between 0-7. L-ness can be a useful metric to look at to segment your users by engagement tiers. Looking to understand who your most active users are and what drives them to have a great experience in your product? Segment by L-ness and pull some sample user IDs from each segment to better understand their behavior, then figure out how you can replicate their experience across your user base to increase every user’s L-ness.
From 0 → user accounting metrics in no time flat
Historically, you have either needed to be a SQL wizard or have access to a seasoned data science team to spin up a comprehensive suite of growth metrics. Statsig makes it easy to get up and running by automatically calculating user accounting metrics as soon as you start logging events to our SDK. You will see your User Accounting metrics under the “Charts” tab within the Metrics tab in your Console.
No team should fly blind when it comes to building a new product or business, and Statsig makes it easy to start tracking important product growth metrics on Day One.
Importantly, once you have these growth metrics set up, you’ll be able to see how every feature and experiment affects them. Not only can you track all these metrics - you can get a level of granular visibility that helps you move them up and to the right.
Curious how your product’s user growth, engagement, and retention looks? Jump into the Statsig Console to get started today!
Get a free account
