Products
Solutions
Resources


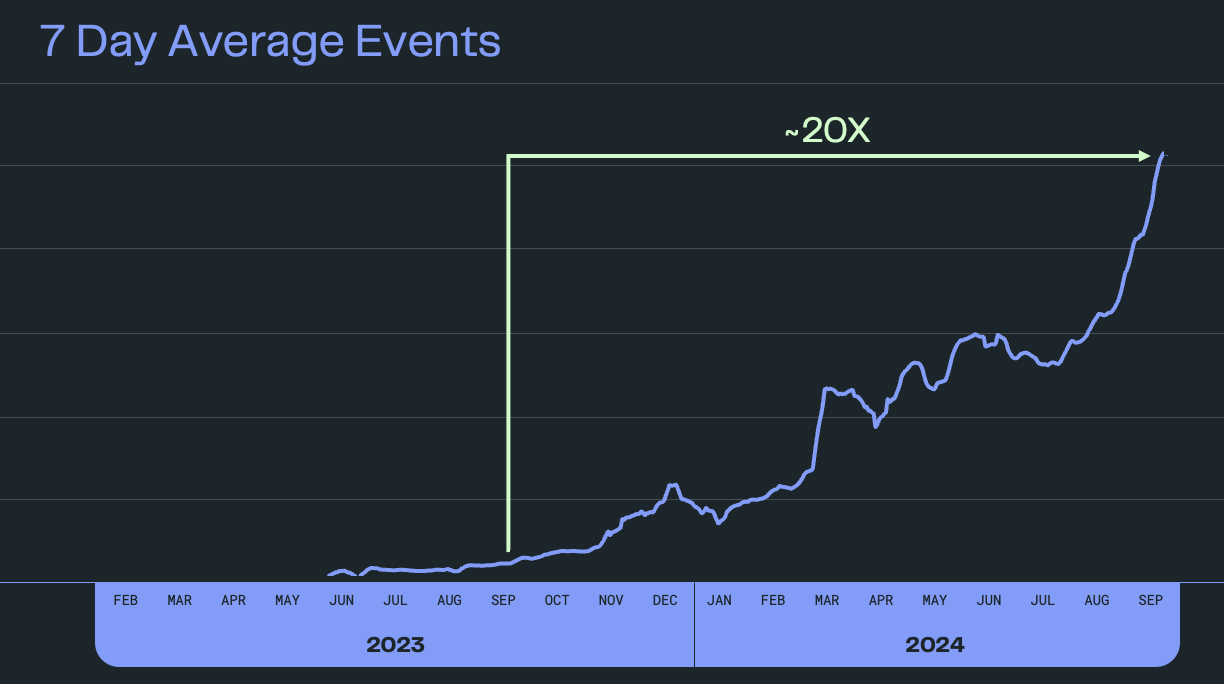
At Statsig, we collect over a trillion events a day for use in experimentation and product analytics.
This is pretty massive scale—the type of scale that most SaaS companies only achieve after years of selling their products to customers. But we're only 3 years old!
Even crazier, in the last year, we've 20Xed our daily event volume as we've scaled with customers like OpenAI, Atlassian, Flipkart, Figma and others. And as we've grown, we've continued to improve our reliability and uptime.
As you can imagine, doing this hasn't been easy. It's meant long hours for our infra team and a fresh approach to our events architecture. In this blog post, we'll share how we did it, what our architecture looks like today, and how you can learn from our experience.
Architecture overview

Our streaming architecture is fairly standard looking for an ingestion pipeline, and is split into 3 key steps:
Request Recording
Log processing/refinement
Routing
All inter-layer communication is done via Pub/Sub and GCS.
Request recording
Our number one priority is to prevent data loss, which means that our system is architected around minimizing the possibility of data being dropped.
Even when running in a degraded mode, it is able to continuously and reliably ingest data. Because of this, our data ingestion layer (written in Rust) has been designed to have as few responsibilities as possible. Its sole job is to get data into some semi-persistent storage as quickly as possible, with several cascading storage options in the case of failures or outages.
Even in the event of an auth service outage, it will still record requests, but with a flag to authorize the request async in the processing layer.
Log processing
After our ingestion layer, we have our business logic layer. Here is where we apply all of the transformations to get data into the expected format for all downstream consumption.
Since we have already persisted the data in our ingestion layer, our main concerns here are correctness, throughput, and minimizing duplicates. We use distributed caches to minimize duplicates and some advanced batching strategies to maximize throughput while continuing to guarantee an “at least once guarantee.”
In order to let our engineers quickly and safely make changes to this layer, we have several layers of testing that ensure any difference in event processing behavior is alerted on before it makes it to production and can be acknowledged by the engineer responsible if it is intended.
Routing
Our final layer is the routing layer, which is responsible for getting data directly into any of the sources that are needed for downstream consumption.
This routing layer can dynamically route data based on things like customer and event type, as well as use different strategies for getting data into the destination based on latency and/or cost needs.
Shadow pipeline
Given how critical it is for this pipeline to function correctly, we invested significant effort into building an end-to-end test comparing our current prod build to the release candidate.
For testing, a couple million events are streamed to both deployments in a large burst. The resulting tables are then compared across a suite of checks to ensure that everything is within expected tolerances. The large spike in traffic also acts as an informal stress test, allowing things like HPA configuration and pod lifecycle to be tested on a regular basis.
Cost optimizations
The architecture above is great for getting started, but the real challenge of streaming a trillion events a day is to do it cost-effectively. We have invested a significant amount of effort in economical ways to make this happen.
Here is everything we have done to save a little extra money:
GCS upload through Pub/Sub: Directly inserting data into Pub/Sub would be extremely expensive. Instead, we write the bulk of the data in a compressed format directly into GCS and write a corresponding file pointer to Pub/Sub. This allows us to take advantage of Pub/Sub’s serverless architecture while paying 0.01% of the price.
Spot nodes: Given that Pub/Sub deals with all statefulness of the work, disruptions to workloads are very acceptable. All of our async workloads run primarily on spot nodes, which helps keep VM costs low.
Deduplication: For running experiments and displaying diagnostics for exposures, only unique events matter. However, we receive a very large amount of duplicate events that offer no value to customers. To prevent this duplicate work from reaching deeper parts of the pipeline, each event is hash-checked against a Memcache instance, and thrown away if previously seen. This system was originally written using a Memorystore cluster, but we found Memcache to be significantly less expensive to deploy.
Compression: Originally, our messaging was done with
zlibcompression. On most of our payloads, this gave us ~90% compression. Swapping tozstdproduced 95% compression and for less CPU.Batching efficiency: One of the larger costs in our streaming pipeline is class A operations to GCS. Originally, the request recorder was run with a very reasonable request of 2 CPU. Increasing this to 12 CPU has allowed huge improvement on batching efficiency, without sacrificing e2e streaming times.
Load jobs versus live streaming: Not all data is created equal, and low-latency streaming can be quite expensive. One of the most significant cost savings in our routing layer was achieved by transitioning to load jobs in BigQuery instead of using the streaming write API for all latency-insensitive data.
Deployment tuning: Node-based services are very difficult to tune for CPU-intensive workloads because event loop starvation leads to all sorts of unintended consequences and unhealthiness. This prevents running huge, chunky pods for processing, and instead prefers a very high number of pods. To help make this cost-effective:
We use flow control settings and concurrency settings throughout to help limit the maximum amount of CPU a single pod will use. Variance is the enemy of cost savings.
Pods are run without any limits, and are aggressively stacked on hosts. CPU and memory requests are tuned based on host utilization instead of pod utilization. In aggregate, CPU utilization is fairly steady, and tuning the deployment at the host level is significantly easier and more efficient than at the pod level. This allows our host utilization to be very high for all async processing.
Get started now!
