Products
Solutions
Resources

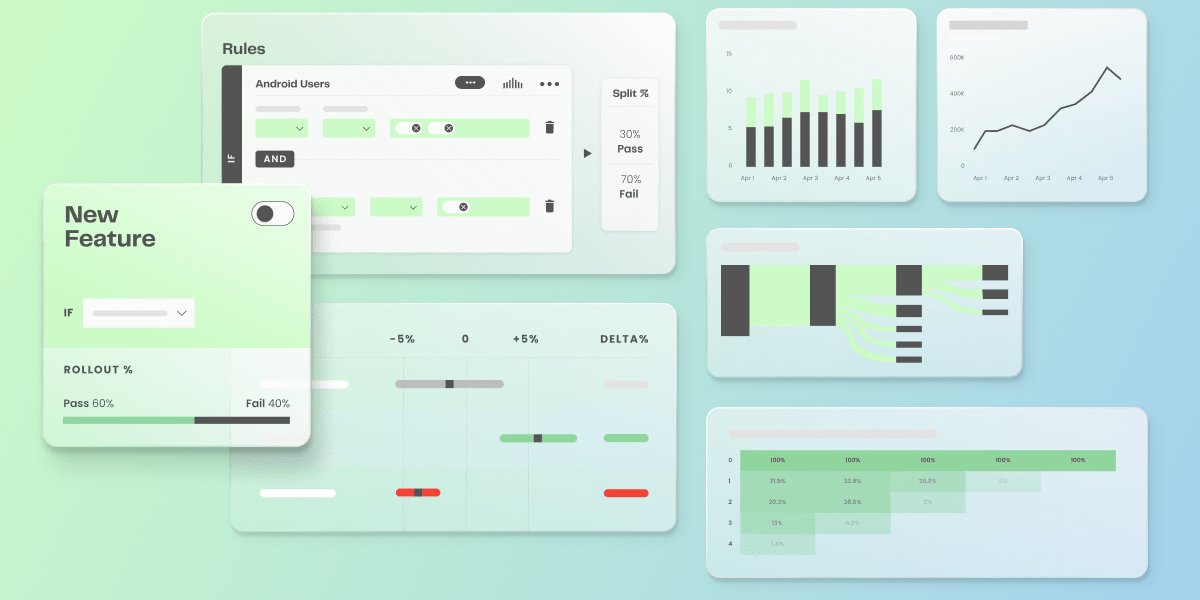
Everyone deserves a good dashboard.
Product managers, other product-facing teams, and marketing teams, all work alongside data experts, seeking ways to refine their development cycles and enhance product offerings by observing and measuring data.
A well-designed dashboard, built on top of metrics and experiment outcomes, can be the compass that guides you through the sea of data, helping you visualize progress, identify trends, and make strategic decisions with confidence.
After all, customer, interaction, and product data only becomes useful when teams have access to tools that can help make sense of it and build data-driven product development cultures and strategies.
One of the most effective ways to do this is by leveraging powerful experimentation and product analytics tools like Statsig.
Step-by-step guide to building your experimentation dashboard
Prerequisites
Before diving into dashboard creation, ensure you have the following:
A Statsig account (which automatically includes access to the analytics platform)
A few metrics and KPIs created are relevant to your product that you wish to track
(Get started logging events if you haven’t already!)
An experiment running in Statsig that you wish to track
Step 1: Define your goals and key metrics
Begin by outlining the objectives of your dashboard.
What are the key questions you want to answer? Are you looking to measure user engagement, conversion rates, or feature adoption?
Maybe you’ve got a signup experiment running for new users, but you’re looking for deeper insights. Or maybe you’re focused on measuring the impact of backend and operational performance like UI load times and latency metrics.
Once you have your goals in place, identify the metrics that will serve as indicators of success. Statsig's Metrics Catalog allows you to tag and organize these metrics for easy access during analysis.
Not sure where to start? We have a few guides in place to walk you through metric creation:
Step 2: Create a new Dashboard
Navigate to Dashboards: In the Statsig console, go to the Dashboards section and click Create.
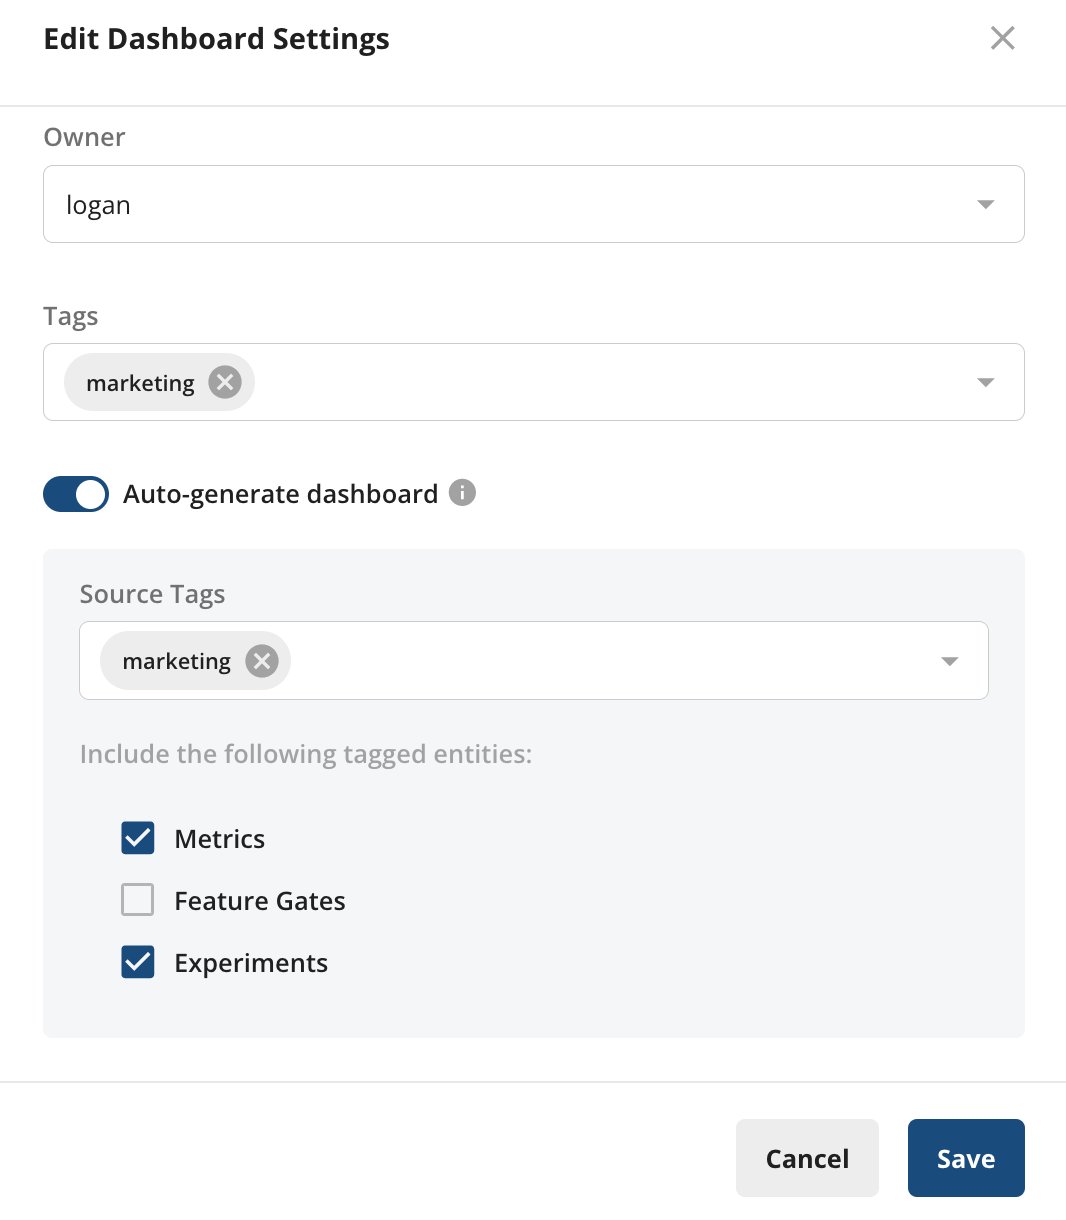
Configure your Dashboard: If you want metrics, gates, and/or experiments with specific tags automatically added to your dashboard, select “Auto-generate dashboard” and select the type of data you want to auto-include:

Alternatively, you can create a dashboard from an existing metric definition by clicking on the export button, which will prompt a metric creation flow:


Once a dashboard is created, widgets can now be added to track metrics, gates and experiments!
Step 3: Add charts and visualizations (Widgets)
Statsig's dashboard interface is intuitive and user-friendly.
You can add various widgets, such as charts, single metric values, or gate/experiment outcomes, enabling quick and easy access to metrics and results that are most important!
Statsig supports many types of charts out of the box, including:
Drilldown Charts
Retention Charts
Funnel Charts
User Journey Charts
Here’s how to get started:
Select the type of metric you want to create. In this example, we’ll create a line chart to track pages that our users are visiting over time.
Apply filters (if applicable) to pare down the metrics to relevant data only. Here we’ve applied a filter to only consider landing_page_views for the US and Mexico.
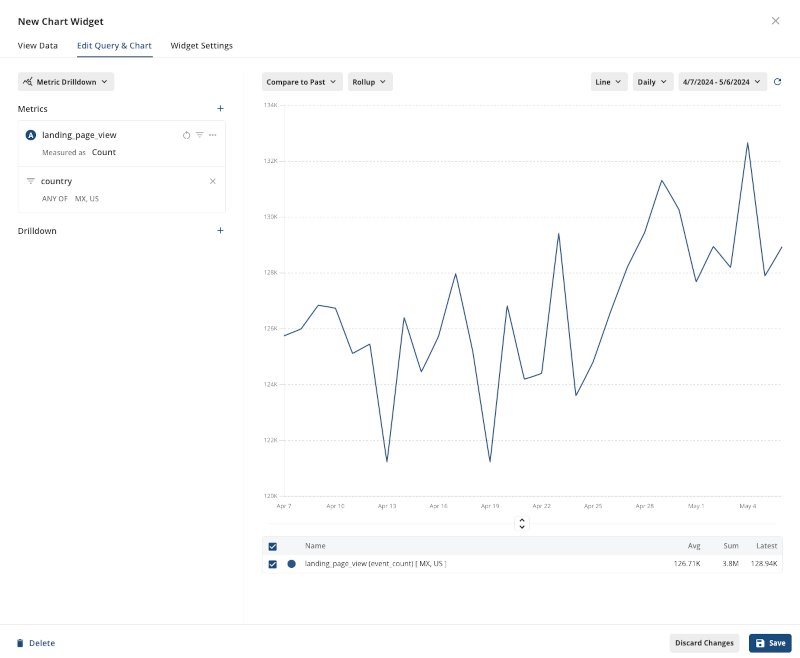
Configure the widget settings based on your desired view and aggregation. Here you can define the title of the chart, write a description, and configure a time range calculation window. We’ll give this chart a meaningful name: Once finalized, save the chart.


Step 4: Incorporate experimentation data
The previous steps demonstrated how to use Statsig’s dashboards to track important metrics/KPIs over time and filter results for more granular analysis, but what if you want to track experimentation efforts within your org?
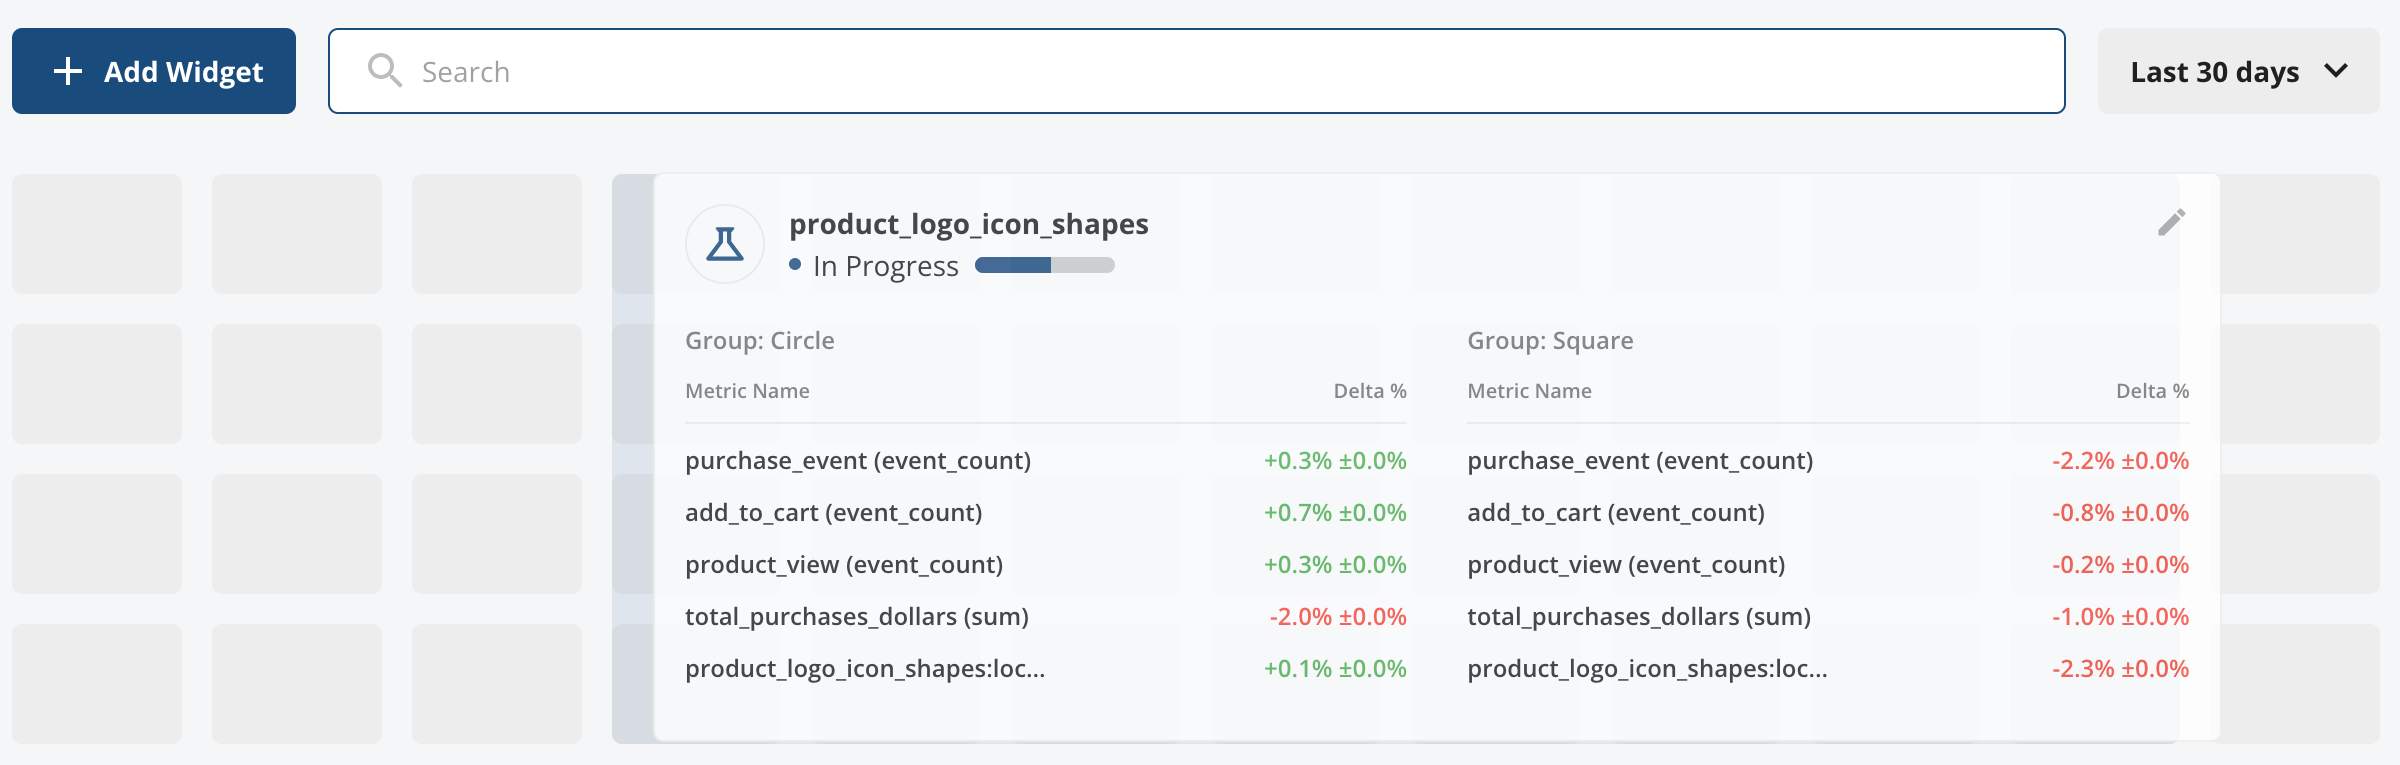
This is where a Pulse widget comes in!
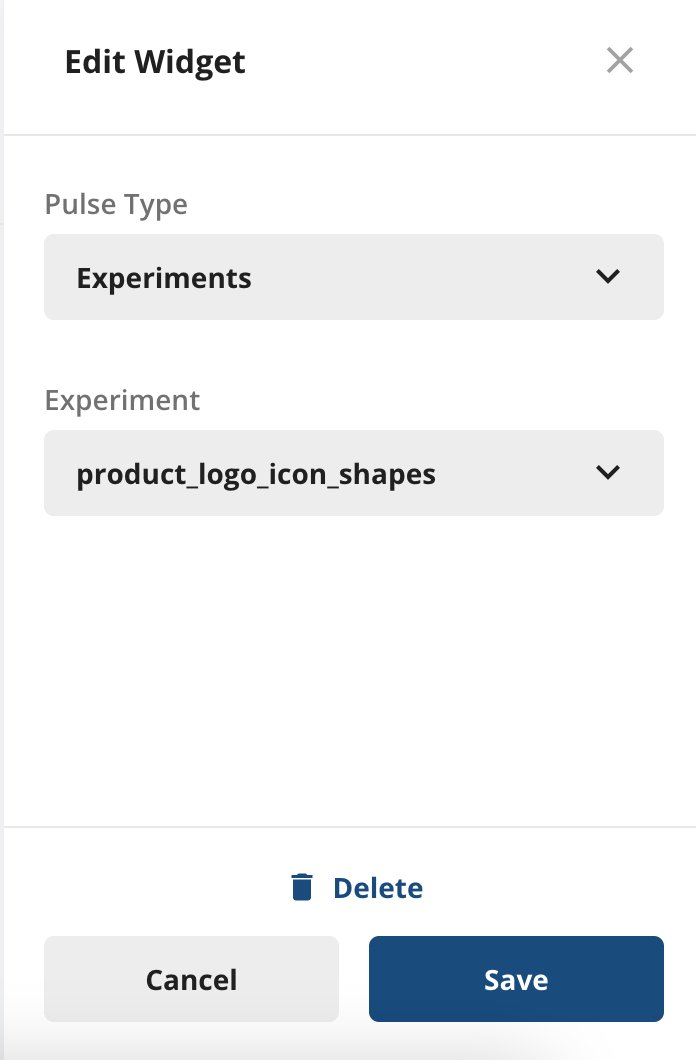
Create a Pulse widget to track an experiment in your Statsig project
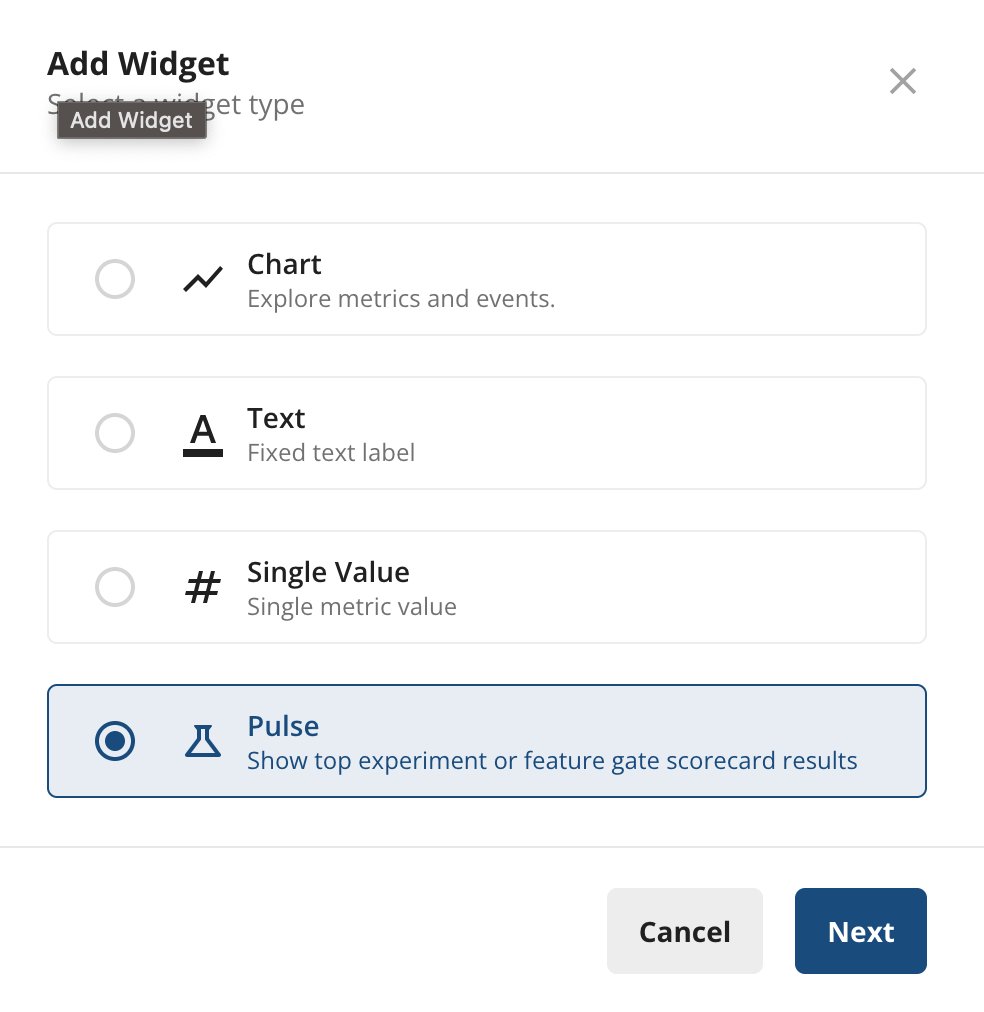
Select the type of pulse, in this case an experiment and then select the experiment you’d like to track in the dashboard. Click Save when you’re done:
Rearrange your charts and customize the dashboard appearance. Statsig’s dashboard tool allows you to easily drag and drop to rearrange widgets quickly. You can even resize widgets, customize the look of a specific dashboard, and put the most important metrics towards the top.


Step 5: Customize and segment data
Customization is key to a dashboard that speaks directly to your needs.
Dashboard widgets can be modified after they are created to better encapsulate the data you care about.
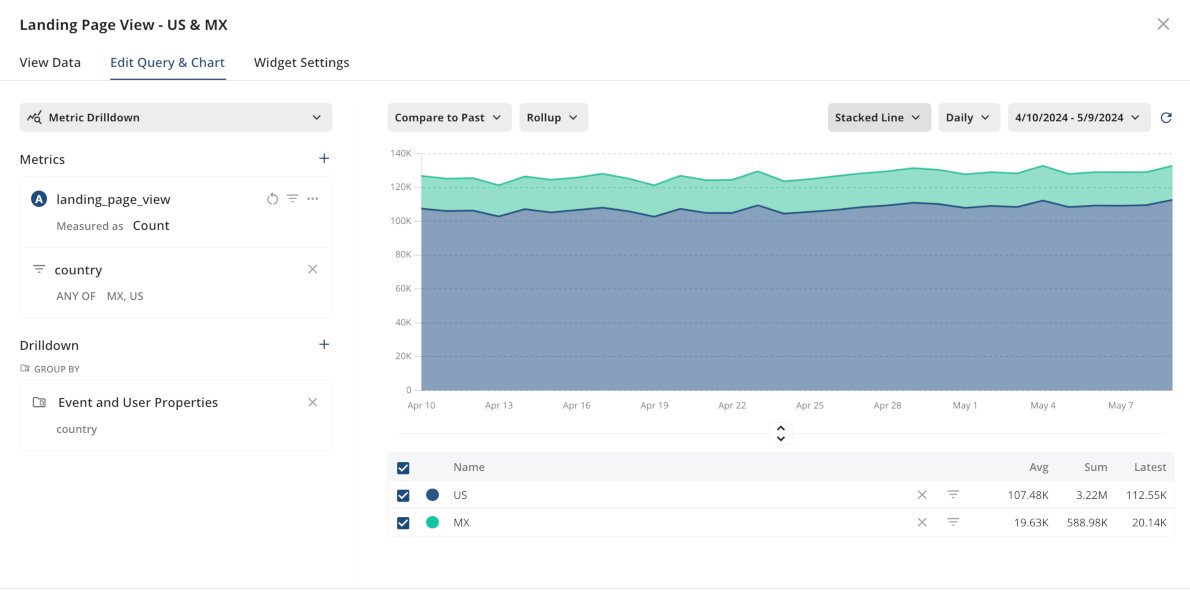
Let's revisit the landing page chart that was created in Step 3. In order to make the data easier to interpret for the various populations, we’ll apply a group by and change the graph view to a stacked line chart.
Click Save when done modifying:
Step 6: Share and collaborate
A dashboard is most effective when it's shared with your team.
Statsig's platform allows you to share your dashboard with stakeholders, fostering collaboration and ensuring everyone is aligned with the product's direction. Over time, the content of your dashboard and the number of dashboards will grow.
Want all your team's relevant data to be auto-added to your dashboard?
In the dashboard settings, you can toggle “auto-generate dashboard.” This feature will automatically add any metrics/feature gates/experiments that contain the designated tags.

Step 7: Review and iterate
Finally, remember that a dashboard is not set in stone. Regularly review its effectiveness, gather feedback from your team, and make adjustments as needed. Your dashboard should evolve alongside your product and experiments.
Driving progress with dashboards
By following these steps, you'll have a dynamic dashboard that not only tracks your product experimentation efforts but also serves as a strategic tool for informed decision-making.
Remember, the goal is to create a living document that adapts to your product's journey, providing clarity and direction every step of the way.
For those looking to delve deeper into the capabilities of Statsig or explore advanced dashboard features, consider checking out additional resources such as Statsig's official documentation or joining the Statsig community for insights and support.
Get started now!
