Products
Solutions
Resources


At Statsig, we’ve already transformed the process of deploying new features by backing every feature gate (feature flag) by an A/B test during rollout.
This provides a complete view of each feature’s performance against your company’s suite of metrics. The best part… this is all done automatically; Zero overhead, no extra steps, and this doesn’t change how long your rollout takes.
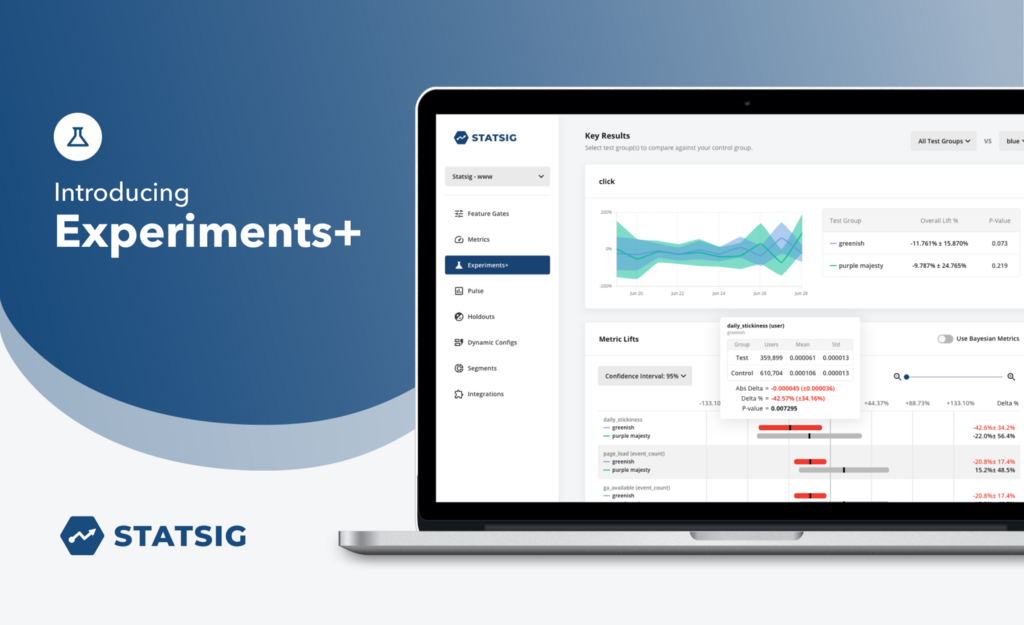
But what if you needed something even more powerful? What if you want to run A/B/n experiments? Or need to avoid experimental collision? What if you prefer a detailed report focussed on validating your hypotheses? Introducing Experiments+.
What is Experiments+?
Experiments+ is Statsig’s formal A/B/n testing and experimentation tool. It lets experimentalists:
Set up hypotheses, define key metrics, and set a target completion date
Set audience targeting rules
Deploy multiple test groups, at custom percents
Set up layers (aka Universes) allowing you to avoid collisions by running mutually exclusive experiments
Receive a detailed report to evaluate your hypotheses against the key metrics.
Holistically understand the experiment’s impact on your company’s entire suite of metrics. This is done with our popular “Pulse” view that helps you understand the primary, secondary and ecosystem effects. This allows you to generalize learnings, creating new hypotheses and ideas.

3-Step Creation Flow
At Statsig, we firmly believe A/B Testing doesn’t need to be difficult. In line with this philosophy, we’ve built a 3-step creation flow for Experiments+.

Learn More
This is just the first version of Experiments+. We have many more exciting features in the works and would love to hear from you on what else we should be building and whether this is works for you.
Want to check out Statsig? You can signup for a free account at https://www.statsig.com. You’ll be able to use our SDK and console and start building immediately. You can also play with our demo account at https://console.statsig.com/demo which includes Experiments+.