Products
Solutions
Resources


We’re excited to announce the release of stratified sampling on Statsig.
Stratified sampling allows you to avoid pre-existing differences between groups in your experiments along metrics or the distribution of users across arbitrary attributes.
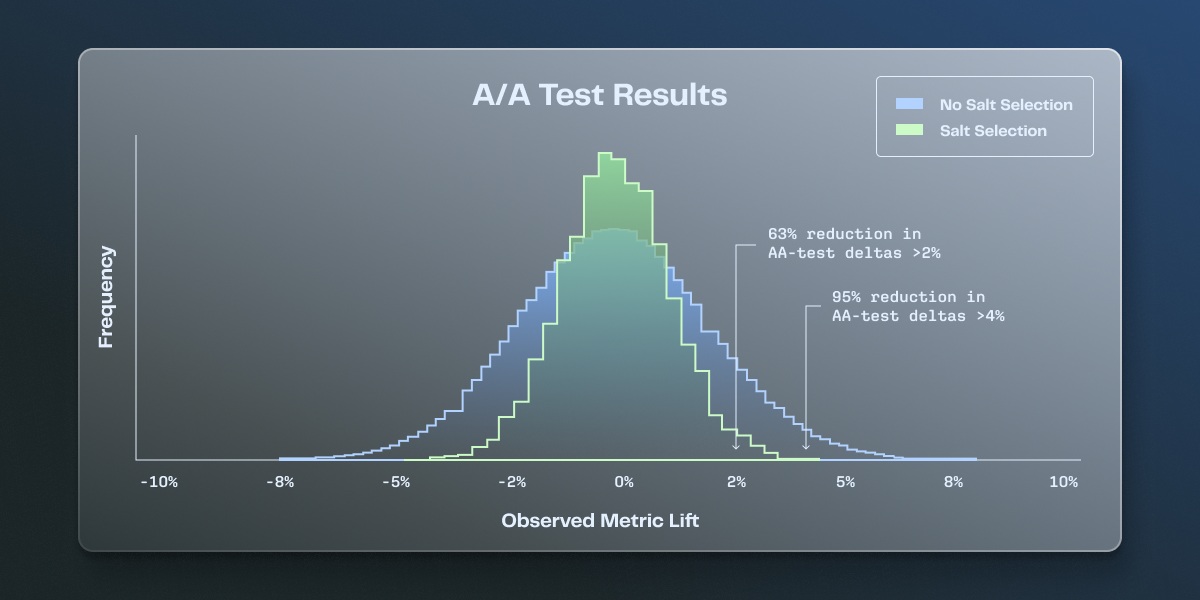
For B2B tests, or tests where a tail-end of power users drive a large portion of an overall metric value, this feature meaningfully reduces both false positive rates and false discovery rates, making your results more consistent and trustworthy. In our simulations, we saw around a 50% decrease in the variance of different A-A test results.

Why we support stratified sampling
Running an online experiment means fighting against a slew of factors that can make your experiment analysis fail to produce useful results. Modern experimentation platforms have a lot of tools to help address these. For example:
Winsorization or capping helps to reduce the influence of outliers
CUPED can give you more power in less time
Sequential testing lets you peek without inflating your false positive rate
SRM checks detect imbalanced enrollment rates
Pre-experimental bias detection helps you know if your experiment - by bad luck - randomly selected two groups that were different before the experiment ever started
When we launched pre-experiment bias checks, we realized that this feature was useful for visibility, but fundamentally didn’t solve the problem. Customers were asking for guidance on how to use and prevent issues.
Unfortunately, in cases of extreme bias, there’s not much to do except restart the experiment with a new “salt”—meaning throwing out the data you’ve already collected.
At the same time, Statsig has many customers running small-unit-count experiments, especially in the B2B space.
In supporting these customers, a common issue we encountered is that a handful of end users would drive the majority of the distribution. Even with winsorization, having an imbalance in this segment would drive an imbalance in experiment results orthogonal to the true effect of the experiment.
Stratified sampling dramatically reduces the incidence of both of these issues.
How it works
The Statsig SDKs use a salt to randomize or bucket experiment subjects. When you enable stratified sampling, we'll try n different salts (100 for now) and evaluate how "balanced" your groups are.
We evaluate this balance based on either a metric you pick or an attribute you give us describing your experiment subjects. We pick the best salt from this set and save this as the salt to use.
What does this do in practice?
Salt selection will help you to run more experiments in less time. Your results will be meaningfully more consistent and trustable, boosting your experiment’s confidence level and reducing your false positive rate at the same power.
When running multiple experiments, restarting the same experiment may result in different outcomes. Stratified sampling reduces this variability significantly.
In practice, you will configure stratified sampling before running an experiment in Statsig by configuring a metric or attribute to balance across.
For metrics, Statsig will striate users into buckets and do a weighted chi-squared across the buckets to find a good salt. For attributes, Statsig will perform the same analysis but with the buckets you’ve defined. This only takes a few minutes, and can become a part of your standard experiment workflow.
Read now: Statsig's stratified sampling documentation
Request a demo
