Products
Solutions
Resources


Two weeks ago, we ran an experiment: We purchased a digital billboard on Highway 101, just south of San Francisco.
We’re a data-driven company. We try to make every decision—particularly spend decisions—with a clear sense of what we’ll get out of it, what the success criteria are, and how we can measure ROI. But the impact of billboards is really, really hard to measure.
Below, I’ll run through why we decided to try a billboard in the first place, how we launched it, how we tried to measure impact, and what we learned.
Why a billboard?
The short answer: Everyone told us we should do a billboard! From our investors to our friends we had a lot of people tell us that the secret to building awareness with our ICP (sophisticated software companies) was to put up a billboard on Highway 101 in San Francisco.
We had talked about purchasing a billboard 3 - 4 times over the past year or so, but each time we didn’t go forward with it. We thought it would be expensive, too hard to measure, and too time-intensive to design.
Finally, a month or so ago, we decided to just do it. So we designed the lowest-cost test we could think of.
How we launched it
The cheapest and easiest way to get a billboard spot in a major market is through digital out-of-home marketplaces. We found a platform called AdSemble that would let us rent a digital billboard on Highway 101 just south of San Francisco for a week. It would cost about $8,000.
$8,000 is a lot of money, but it’s a low price to pay to learn something valuable. We also spent a lot of time talking about launching a billboard. If you add up the effective cost of all of that time, it probably would have been worth it to just try a billboard a long time ago.
Billboard learning #1: If you’re spending time talking about doing something that’s relatively inexpensive to test, just test it.
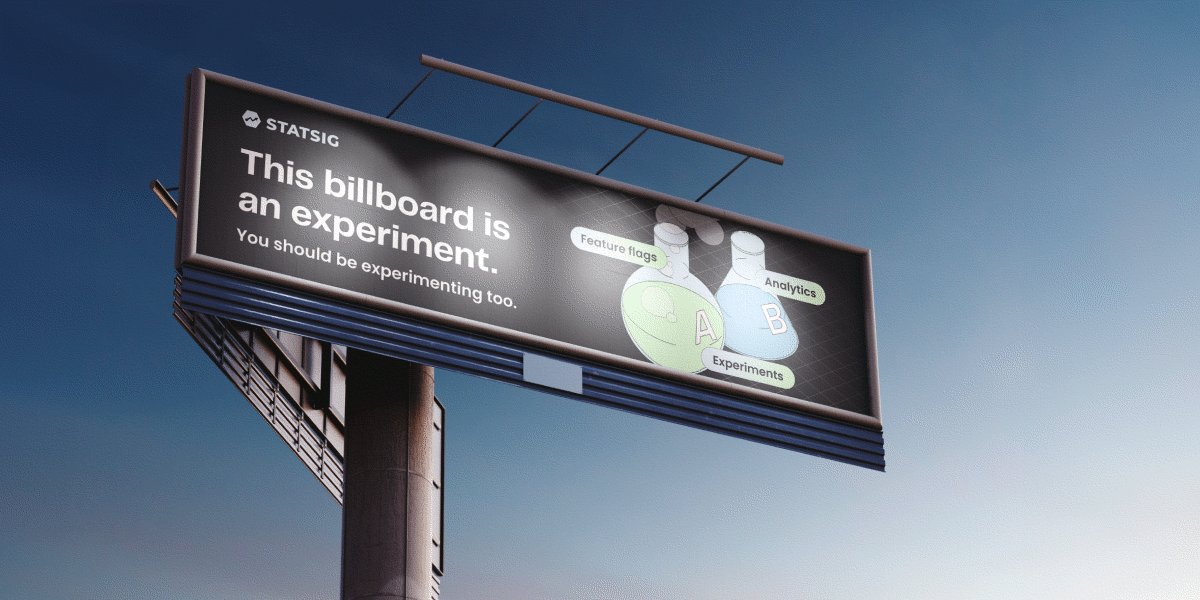
Once we had decided to launch it, we gave ourselves a hard deadline. We pre-bought the billboard space ~2 weeks out, before we knew what our final idea was. Our initial ideas were very bland, but over the two weeks our brand design and marketing teams came up with a great concept—which we ended up rolling out.
The actual design work was relatively quick, once we knew what we were going to do. The hard part was coming up with the right concept. A deadline forced us to get creative, but not wait for the perfect idea. We ended up in a great place (as you can see below)!
Billboard learning #2: Give yourself a forced deadline to launch something. Done is better than perfect!
How it turned out
The billboard looked great!
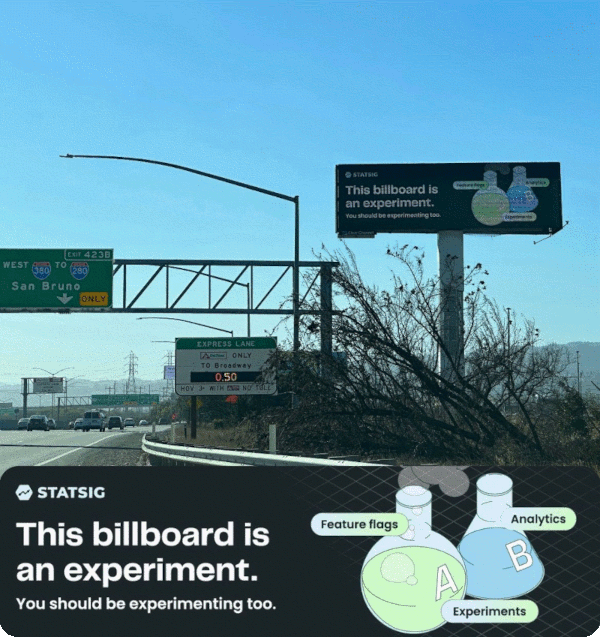
Unfortunately, there were some things about the placement that we didn’t fully understand.
First, the area we placed it had very fast traffic because it was near the airport but far from the city. When one of our employees drove by it, they had a hard time seeing it
Billboard learning #3: Put your billboard in an area with heavy traffic, so people have more time to look at it.
Second, we misinterpreted the description provided on the platform describing how our ad would be shown. We selected “Play My Ad All Day for a Fixed Rate” which we assumed meant it would show on the billboard 100% of the time.
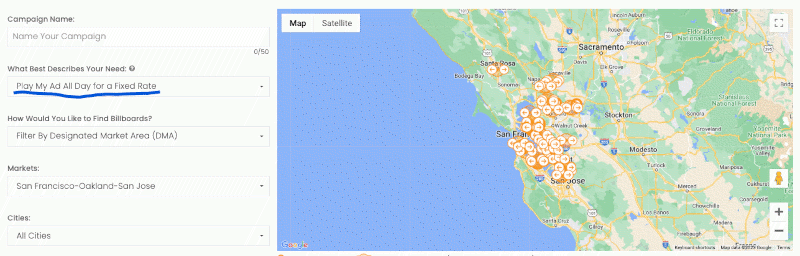
In reality, our ad was played on rotation with other ads, so it was visible for something like 1/6 of the day.
Billboard learning #4: When buying a digital billboard, clarify if your ad will be shown on rotation or if it will be the only ad shown.
How we tried to measure impact
Our hypothesis going in was that we wouldn’t see a measurable effect from a 1-week billboard placement. Any effect certainly wouldn’t be statistically significant or easy to isolate.
Still, we had a few ideas for how to get some sense of directional impact:
Look at web traffic from San Francisco during the week the billboard was live
See if anyone from our network told us that they saw the billboard
Look at other data (i.e., overall web sessions and sign-ups) to see if we saw any noticeable bump
Introducing Statsig Warehouse Native
Option 1: Web Data
First, let’s look at the web data. Let’s see if you can see the impact of the billboard!
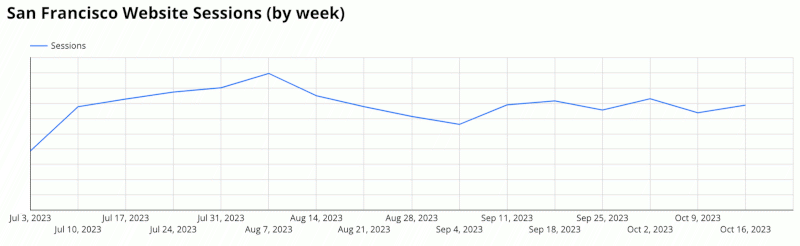
Do you know which week it was? If you guessed October 16th - 22nd (the last week), you’d be right!
What conclusion can we draw from this data? Nothing much! If you used this data, you’d think that the billboard had no effect.
But what if Google Analytics wasn’t attributing location correctly? What if we look at overall web sessions? That might have a signal.
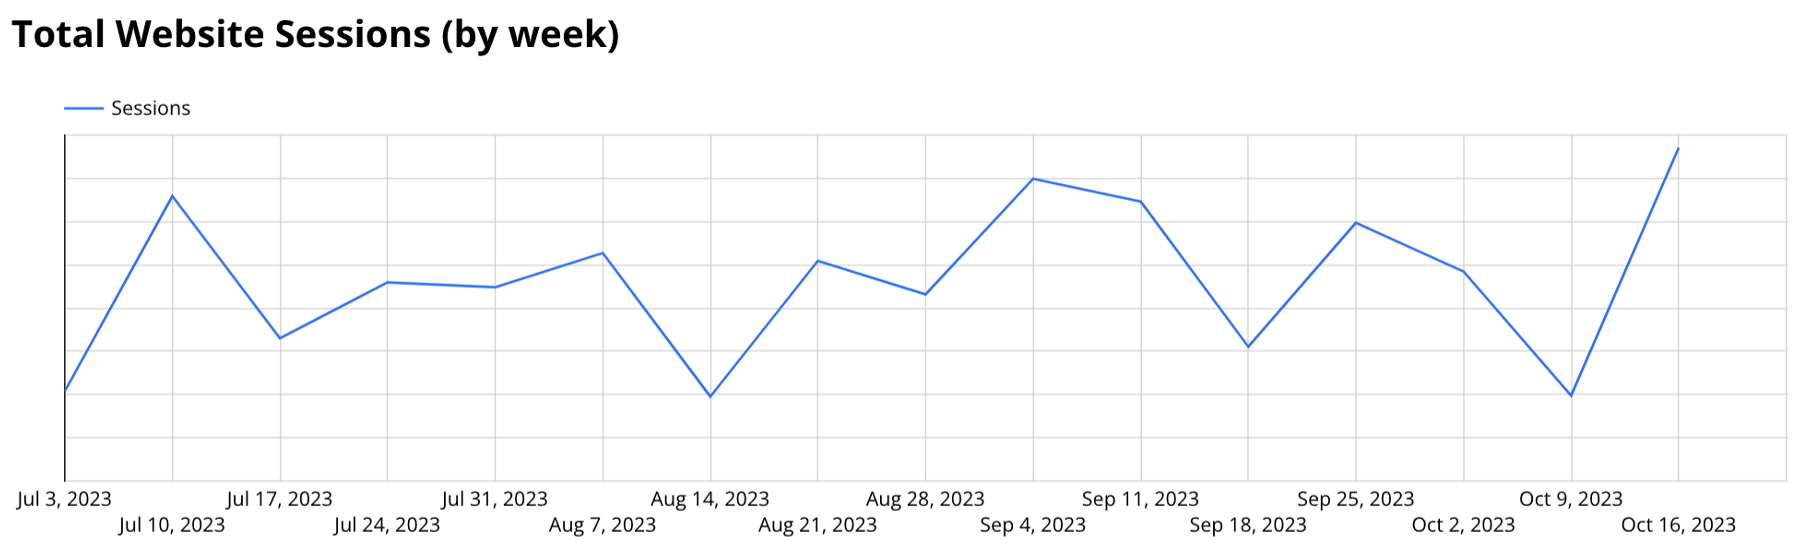
There’s the signal! The billboard must have worked, right? Well, not so fast.
There was a big confounding variable that we aren’t accounting for: A new episode of the Acquired Podcast came out on 10/16, which we had sponsored.
So did the billboard drive additional traffic, or the Acquired Podcast? We cut some of the data by source, location, and other variables, but it was really hard to tell.
Option 2: Word of mouth from our network
This might sound like a weird data source to rely on, but since most people at Statsig worked at great tech companies our friends and coworkers are a pretty good map to our ICP. If they are seeing the billboard and telling us about it, then it was probably hitting our actual ICP as well.
Unfortunately, no one saw the billboard and texted us about it.
Option 3: Other data sources
We looked at week-over-week sign-ups, inbound demo requests, and other top-line metrics but nothing moved in a significant way. Plus, it was impossible to understand what came from the podcast sponsorship and what came from the billboard.
Billboard learning #5: As expected, it’s really hard to measure the direct impact of a short-term billboard placement!
Unexpected impact
We did see impact from an unexpected source: social media! It turns out that people think it’s very cool when you run a billboard.
Our Head of Design’s post on the topic got 124 likes plus a bunch of comments and reposts, driving a ton of engagement. Our friends and colleagues did text us about seeing the social media post about the billboard.
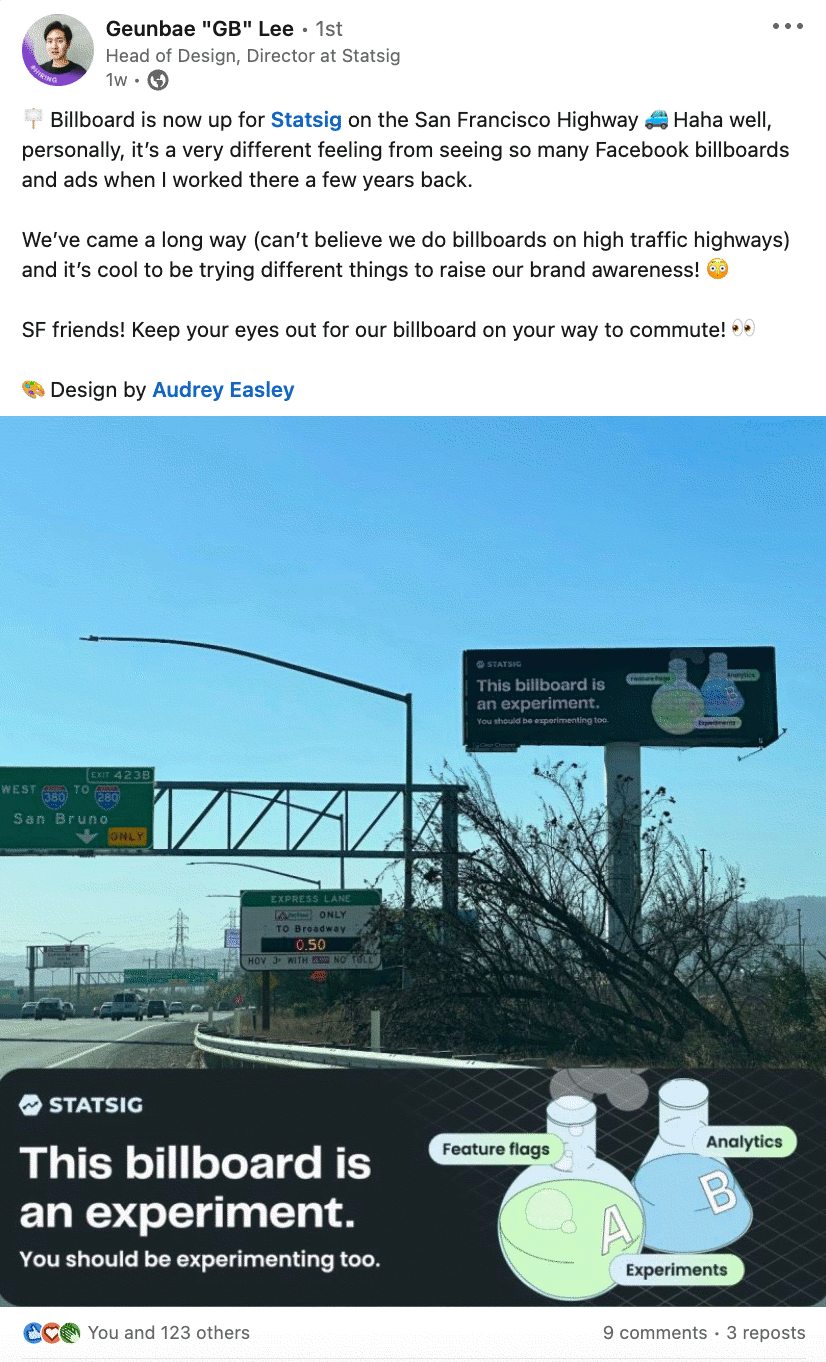
Billboard learning #6: Billboards are a super high engagement topic on social media. Driving social activity should be a part of any future billboard campaign.
Final thoughts
Unfortunately, none of the data were conclusive. We weren’t able to see the impact of the billboard through any data sources. So was it a waste of time and money?
Absolutely not! We learned a TON about what it takes to launch a billboard, which will save us time and money next time around.
Importantly, we found that we couldn’t observe the effect of this experiment. This doesn’t mean it’s not worth trying again. It just means that if we want to see impact, we need to swing bigger.
Billboard learning #7: If we want to measure impact from a billboard, we need to go bigger. This means a longer-term placement in a more prominent location (and more spend).
Building a culture where people try things quickly and try to measure impact is essential for any company—and especially a fast-growing startup.
While this wasn’t a typical product experiment, it’s a great illustration of how a data-driven culture of experimentation can be applied to all kinds of decisions.
Follow Statsig on Linkedin
