Products
Solutions
Resources


Offering discounts in the eleventh hour is not the growth strategy of champions.
For B2B SaaS applications, a user’s very first login or download experience has a significant influence on their engagement metrics.
For product-led growth (PLG) strategies, the intuitiveness of the self-service journey plays a pivotal role in driving sustained usage and retention.
At the heart of success lies the *aha moment—*when users first experience the true value of your product. The quicker you guide them to this revelation (decrease time-to-value), the more likely they are to become sticky, which significantly impacts core metrics such as daily active users (DAU) and ultimately retention and net recurring revenue (NRR).
Successful onboarding-for-growth implementations
Various leading B2B SaaS enterprises across different categories have recognized onboarding’s pivotal role in enhancing engagement and retaining users. Below are 3 highly successful examples:
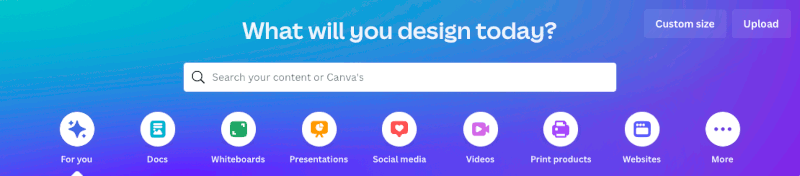
Canva furnishes meticulous step-by-step guidance, interactive tutorials, and an extensive repository of templates in their onboarding workflow. These elements collectively inspire users to initiate design work promptly, empowering them to extract value from their very first login.
Hubspot excels in personalizing its onboarding process to cater to distinct user roles and requirements. Employing progressive profiling, the platform gathers user preferences and subsequently dispenses guided tours, video tutorials, and interactive lessons. This orchestrated approach assists users in harnessing the capabilities of HubSpot's tools effectively.
Salesforce provides a guided setup wizard that walks users through the initial configuration process. This wizard helps users define their business requirements, set up user profiles, customize fields, and import data. They also incorporate real-life business scenarios to help users understand how to apply the platform to their daily tasks.
Testing and identifying winning features
The positive impact of the onboarding elements above was far from accidental: These companies are known for their PLG mindsets and experimentation cultures. Through deliberate efforts, they ventured into novel onboarding approaches aimed at enhancing customers’ experiences.
Upon interacting with these platforms, a noticeable pattern emerges: these companies exhibit a steadfast commitment to perfecting the crucial components of their core workflows.
Onboarding themes
Here are some general onboarding themes the above companies got right:
Incorporating contextual tooltips or pop-ups that empower users to navigate through the workflow (sometimes even including a brief autoplay tutorial)
Highlighting specific high-value feature(s) that give early wins for users
Featuring a “one-click quick start” or similar capability that automatically configures basic parameters for immediate use of features
Offering different plans such as a free trial with limited features vs a premium trial with full access
Personalizing messaging based on the user's persona such as their industry or role
But no two businesses are alike, and copying these exact formulas isn’t necessarily a one-size-fits-all solution.
While these ideas are promising in theory, it's vital to validate your hypotheses and confirm that implementing the feature truly improves your targeted metrics without inadvertently affecting others.
For instance, the new feature might boost the percentage of users successfully completing onboarding tasks during their initial login, yet it could unintentionally create a knowledge gap that subsequently reduces overall active usage.
This is why A/B tests are crucial (and also where Statsig comes into play 👋).
With the ability to run multiple tests simultaneously, you can effortlessly identify features for the onboarding experience that drive core metrics. Below is an outline of what the process would look like:
Creating an A/B test for onboarding
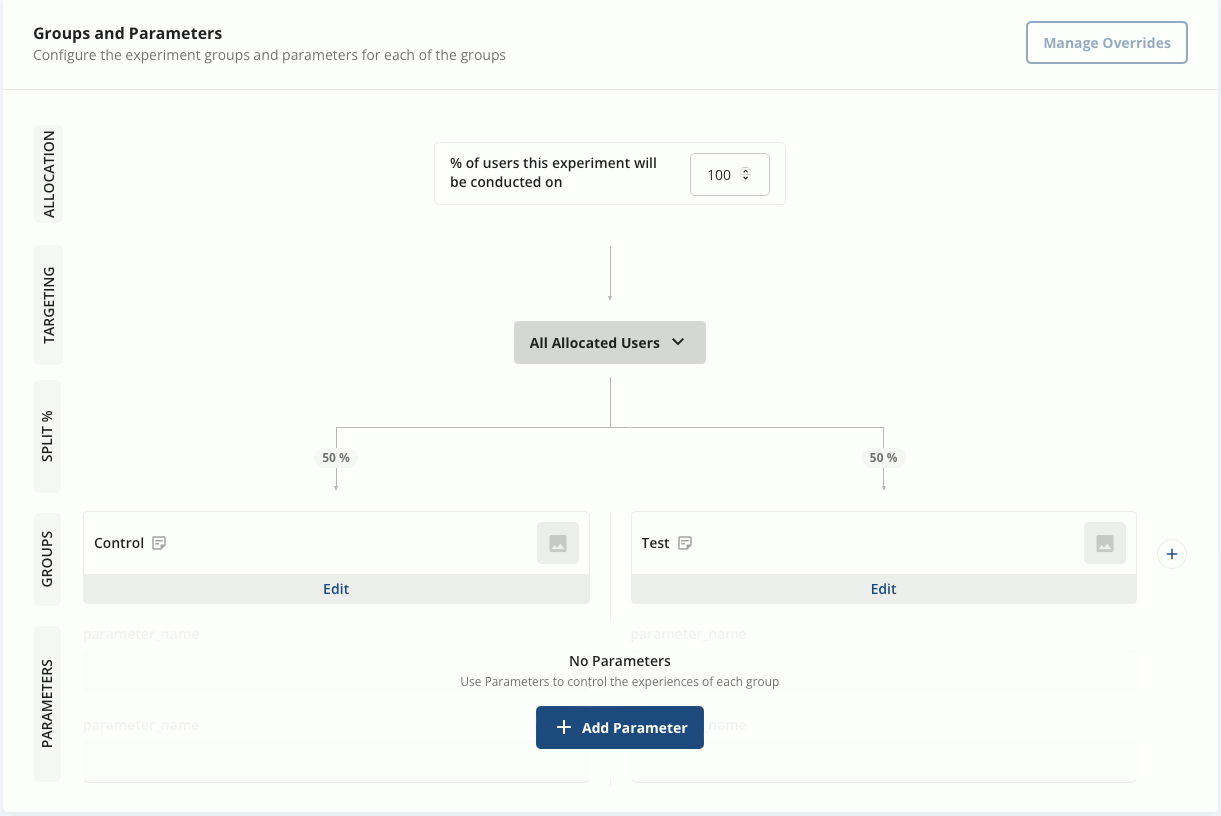
Step 1: Create an experiment in Statsig
Fill out the scorecard for the experiment to establish a hypothesis, and specify the relevant primary and secondary metrics.
Example experiment hypothesis: Tooltip pop-ups at every screen might empower users to progress through the onboarding workflow, thereby increasing the percentage of onboarding completions and subsequently active usage.

During this step, define the test groups and what percentage of users should receive the group's configured values. You can also decide the percentage of users you want to allocate to this experiment.
Step 2: Install and initialize the Statsig SDK
If you haven’t already, follow the installation steps pertaining to the tech stack you’re working with. Next, initialize the SDK using an active client API key and pass a Statsig User ID in your code to enable user assignment and tracking for the different variants of the experiment.
Read our customer stories

Step 3: Review experiment results:
View the Diagnostics tab to track experiment results and event logs on an hourly basis. You can also see the cumulative exposures in the Results tab.
Finally, you can view a snapshot of the metrics of interest that have shifted in the experiment with their statistical significance. This provides valuable information at a glance as shown below, illustrating the experiment's performance.
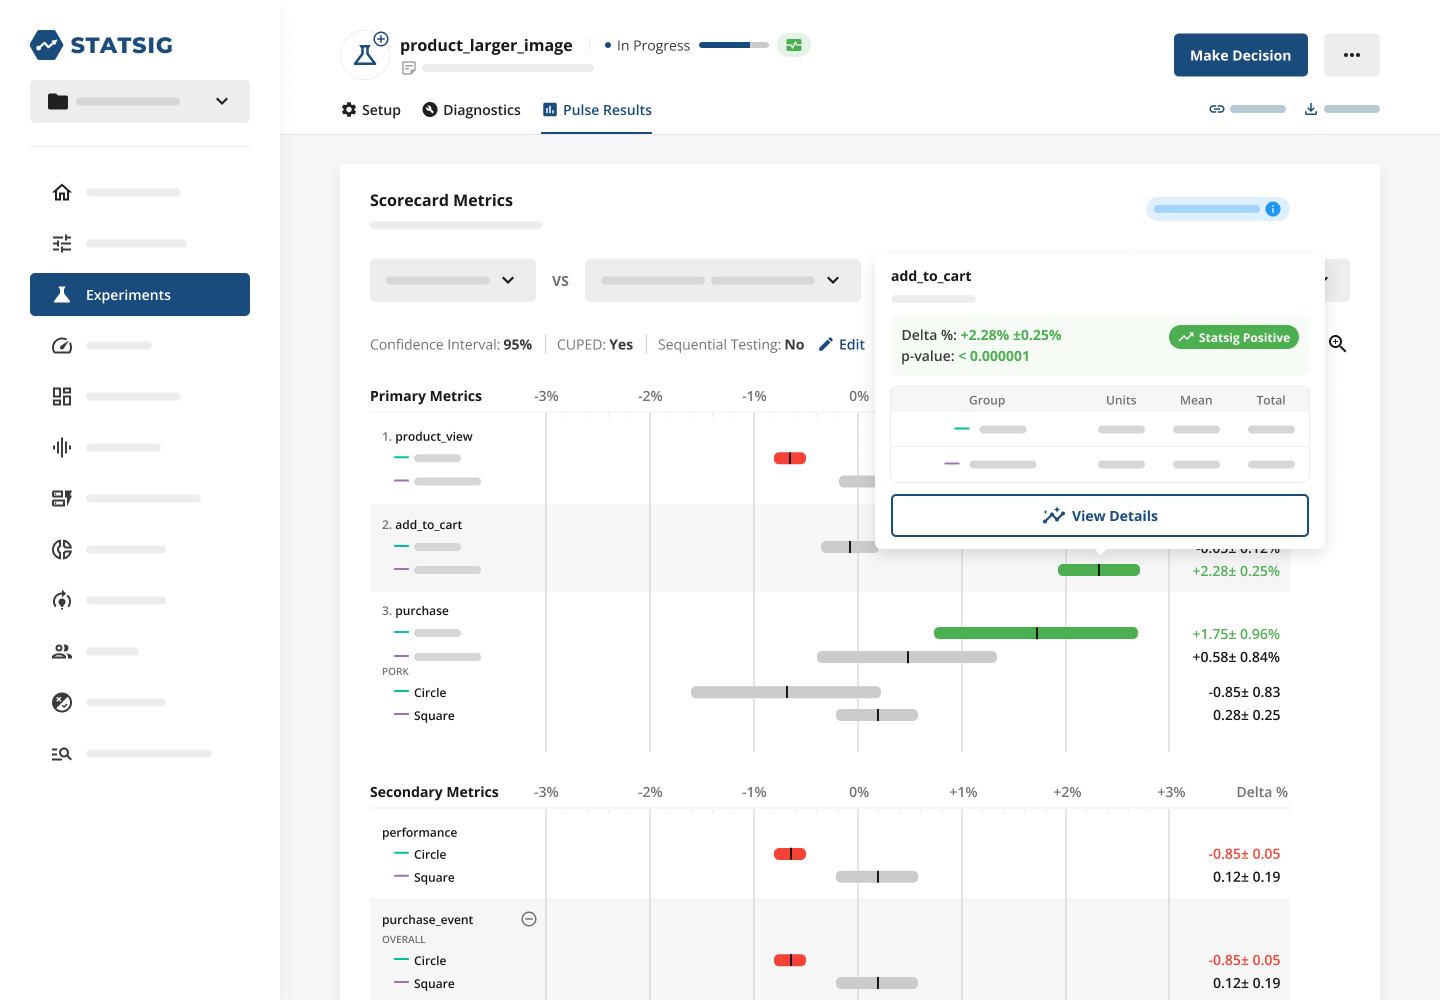
You can now make informed decisions about shipping a feature to enhance the onboarding experience and ensure its impact on core business metrics. For a detailed walkthrough on setting up your first experiment, visit our docs.
"Statsig's experimentation platform enables both speed and learning for us."
Mengying Li, Data Science Manager, Notion
The ROI of improving onboarding
The potential business impact of identifying and implementing the correct features can be substantial.
Consider a SaaS enterprise boasting a $50 million ARR, a retention rate of 60%, and an NRR of 110%. Enhancing the onboarding experience to foster consistent usage and, consequently, elevating retention and NRR by just 5%, could result in an impressive revenue surge of $2.5 million.
Check out our ROI calculator if you would like to learn more about how to think about the business value and ROI of Statsig. Unsurprisingly, some of the fastest-growing B2B tech companies trust Statsig to drive growth.
"It has been a game changer to automate the manual lift typical to running experiments."
Karandeep Anand, Chief Product Officer, Brex
Follow Statsig on Linkedin
