Products
Solutions
Resources

Analyzing funnels is crucial for identifying where users drop off and prioritizing growth efforts.
For example, e-commerce companies like LAAM gained actionable insights into their checkout progression using Statsig's funnel charts. By analyzing different user types (logged-out vs. logged-in), they identified drop-off points and ran A/B tests to optimize various elements of their checkout funnel. These efforts led to a remarkable 75% increase in conversions, directly boosting sales.
As we've continued to strengthen our Product Analytics capabilities, funnel analysis has been a key priority. Over the past two quarters, we've made several meaningful improvements to our funnel charts, providing teams with:
Richer action information to drive more product optimizations
Greater flexibility in defining funnels based on their unique product flows
Tighter integration with the rest of the Statsig platform — specifically our recently launched Session Replay tool
Introducing Product Analytics
Here are three capabilities we shipped last quarter to make our funnels stronger than ever:
1. Conversions in context
We now surface richer context around your funnel, helping you understand how users are (or are not) converting and more efficiently pinpoint opportunities for improvement.
Session Streams + Session Replay Integration: Session Streams allow you to gain event-level insight on the journey a user took through the funnel. It’s extremely useful for debugging feature rollouts, understanding why an experiment performed the way it did, or generally understanding how users convert. Session Streams also integrate with Session Replays, allowing you to actually watch the session at hand.

Richer information for conversion steps: We now provide more context beyond simple conversion rates. We've revamped our UX to prioritize information density and breadth. You can now see more information per step at a glance, including:
Conversion rate so far
Conversion rate from the previous step
Average time so far
Average time from the previous step
Drop-off so far
Drop-off from the previous step
Group-by capabilities: Break your funnel down by event and user properties, feature flags, and experiments to understand how different factors impact conversion.
The value of the Statsig platform is that you have consistent data across various teams at every stage of the product development process (vs having multiple siloed tools for flags, experiments and analytics).
2. More ways to view funnels
When creating a funnel, you can now visualize the information in three distinct ways, each providing unique insights:
Conversion rate: In this classic funnel view, you can see what portion of users convert through each step of a funnel you define. For example, track the drop-off rate from adding items to a cart to completing the purchase. You can now toggle whether the funnel's y-axis is defined by the number of conversions at each step or the conversion percentage.
Conversion rate over time: This view helps you understand how your funnel performance trends over time. It’s useful for detecting unexpected changes in conversion rates or validating that improvements are having the intended effect. For instance, observe how a new payment method impacts conversions week by week.
Time to convert distribution: This view shows the general distribution of time it takes to convert through the funnel. You can see the percentage of converting funnels that convert within each time range on the x-axis. This helps in understanding the typical duration for conversions. For example, identify if most users complete Activation within a day or if it takes longer.

3. Flexibility & Control when constructing a funnel
It's not just about how you view the funnels; we've also now provide more flexibility in how you can construct a funnel, making it easier to understand conversion of even the most nuanced flows through your product:
First-time-ever filters: The first time experience through a product is one you may want to analyze distinctly from general flows through. To make this easy, you can now filter funnel events to the first time a user performed that event, making it easy to understand and improve the first impression users have with your service.
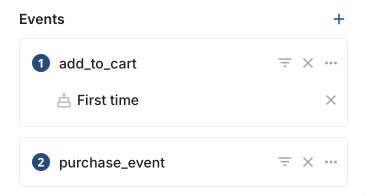
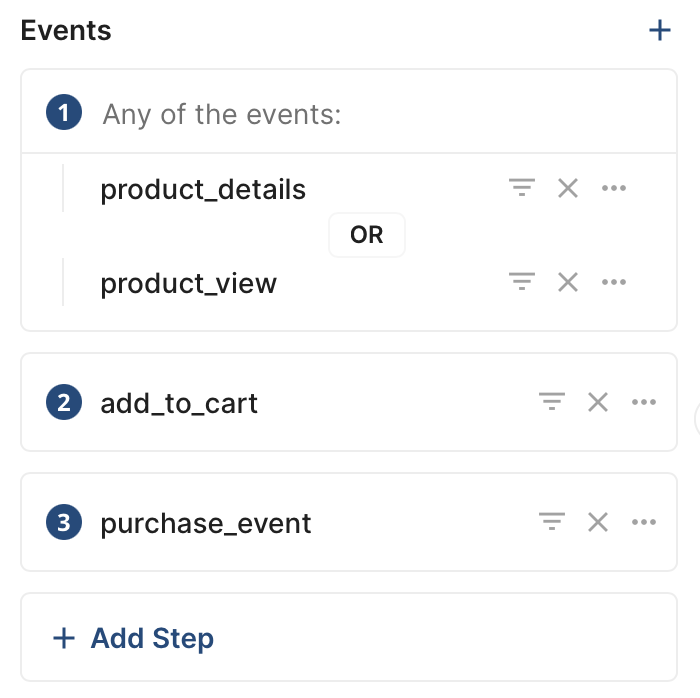
Multi-event steps in funnels: You may group multiple related user actions into a single funnel step. For instance, adding an item to a wishlist or adding it to a cart could both indicate a user’s interest in a product. By grouping these actions together, you can analyze them as a single step in your funnel, simplifying and adding flexibility to your analysis.
Granular control of the funnel conversion window: You can now set the conversion window anywhere from 1 second to 7 days, providing precise control over your analysis.


Ordered, unordered, and strictly ordered funnels: You can now define a funnel to only count conversion that happen in the order specified, conversions that happen exactly in the order specified (with no events in between), or conversion that happen as long as all the events occur within the specified conversion window.
In the advanced menu, you can also choose whether the events in the funnel must be completed sequentially or if completing the steps in any order counts as a conversion. For example, set a 24-hour window to track user actions that should occur within a day or allow flexible ordering for a more open-ended funnel analysis.
We'll continue expanding our Funnels and Product Analytics capabilities over the coming months. Join our Slack Community to share your feedback with us and discuss any use cases you're interested in.
Get a free account
