Release management is the process by which software is packaged, tested, and ultimately published.
Effective release management helps teams and companies deploy software safely at scale. Here are some best practices to get started with:
Best practices for release management
1. Document releases
At its most basic level, when you release new software, you need to know two things: what was released, and when was it released? If and when an issue crops up, knowing what was released will make it easier to reproduce and diagnose the problem.
Knowing when a release happens can help diagnose if a release is the cause of an improvement or regression in a product metric, performance monitor, or other indicators. Sometimes it's obvious when the release happens just by looking at a particular metric:

Being able to pinpoint the when and what for every release makes these types of analyses possible.
Related: Read the whole story behind this chart.
2. Communicate with the team
People need to know when a new release is happening. This can be as simple as an automated bot message (see step 5) letting people know which release is going out, what phase it's in, etc.
We like to have some fun with this at Statsig, and encourage people to play a “push song” when we are pushing to production. This gives everyone their own flair as they monitor the release, and also alerts everyone in the office that a release is happening should anything start to crop up as a result
3. Stage release rollouts
Rather than rollout out from 0-100, release your new version in stages. This helps bound the impact of a new release and identify issues before they arise more broadly. You should always be able to roll back to a previous version if necessary.
Check out Facebook’s release stages: From employees, to 2% of production traffic (still plenty for a product of Facebook’s scale) to 100% of production. Note the monitoring (step 4) applied at each step.

4. Monitor, monitor, monitor
If you do all of the above, but have no diagnostics or monitoring, you are flying blind. Who cares if you stage your rollout to go from 2% to 10% if you don’t have any monitoring to catch issues at the 2% rollout—you’ve just added additional processes, without improving the likelihood of a safe release.
5. Automate releases (and everything)
There are so many opportunities for error in any release process, and the longer the process, the more likely you are to make mistakes.
Each of the above points can benefit from automation:
Automatically generate release candidates rather than requiring a manual build step.
Automatically post when a release is happening.
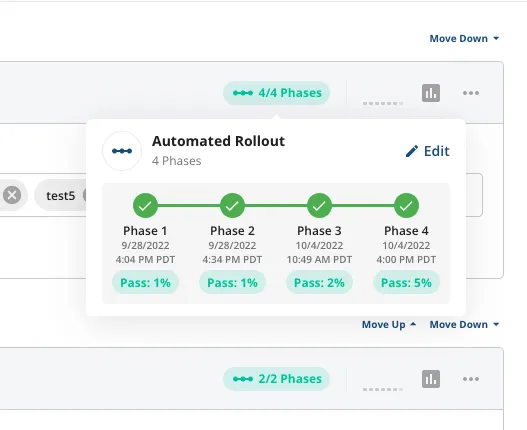
Automatically follow a staged rollout plan, documenting when each step is happening.
Automatically run tests on releases before they go out.
Automatically monitor metric regressions and trigger alerts when key thresholds are breached.
There are plenty of other steps and suggestions, but these five: document, communicate, stage rollouts, monitor, and automate, will help you improve any software release cycle.
How does Statsig apply these principles?
Statsig’s feature gating and experimentation tools use these same ideas to improve the software release cycle further. Putting code behind a software gate allows you to decouple your actual release cycle from the access control and release of a feature. But if you’re flipping a gate to roll out a feature, how does Statsig apply these same 5 principles?
Document: Statsig’s Audit log captures every change to feature and experiment rollouts to help you pinpoint potential causes of regressions (or improvements!)
Communicate: With integrations for slack, Datadog, or a generic webhook, Statsig can alert anyone to feature rollouts automatically.
Stage Rollouts: Statsig allows you to schedule phased rollouts for feature flags automatically

Monitor: Statsig automatically generates metric deltas for partial feature rollouts—any non-100% rollout represents a natural a/b test population to compare: those with the feature, and those without. You can use these metric deltas to verify new features are not causing a regression in key metrics. And you can use the feature gate to quickly roll back a feature if you need to. This connection between features, metrics, and releases, is a powerful tool.
Automate: Leverage the Console API to integrate feature change changes with your CI/CD pipeline. Use a webhook to listen for rollouts or experiment changes and trigger actions wherever you need. Use metric-level alerting to automatically be notified of regressions to your KPIs.

