Products
Solutions
Resources

Bring data into every decision as you build → ship → measure → learn
Today, we are excited to announce the launch of Statsig Product Analytics, a new component of our platform, designed to empower every team within your organization with data at every stage of the product development cycle.
Imagine knowing the exact step in a 5-step checkout workflow where half of your users are dropping off, or identifying a specific demographic with a higher propensity to churn. This would allow your Growth teams to test and iterate on several ideas to solve the problem.
What if you could consistently uncover game-changing insights and innovate with confidence based on data? And what if this data was accessible across all functions, allowing your growth teams to allocate resources efficiently to solve the right challenges?
Introducing Statsig Product Analytics
Last year, we started developing Product Analytics to serve this exact need. We hope Product Analytics provides our customers with decisive, actionable insights more frequently, ultimately helping drive growth with even more conviction.
Who is Product Analytics for?
Product Analytics is for any organization, from startups to Fortune 500 companies, who need immediate answers to their most pressing business questions.
How are users navigating through your product? Where do they drop off within a funnel? What can we learn from power users to make the product stickier for everyone? How does a specific action impact long-term retention? Instantly get answers so you know exactly what to build next and which user segments to target.
Statsig Product Analytics is for everyone.
For mature data-driven companies: Unlocking more value from data and saving costs
Our largest customers are realizing the tremendous value of ditching fragmented point solutions and leveraging an integrated product data stack—a single, unified platform for Product Analytics, Feature Flags, and Experimentation.
"At OpenAI, we want to iterate as fast as possible. Statsig enables us to grow, scale, and learn efficiently. Integrating experimentation with product analytics and feature flagging has been crucial for quickly understanding and addressing users' top priorities."
Dave Cummings, Engineering Manager, OpenAI
The combination of focused efforts and accelerated experimentation velocity can be transformative. Having this single data platform for driving growth offers three key advantages:
Unlocking more value from your data: Easily group metrics by feature flag or experiment rules to debug faster and assess the long-term impact of features on metrics.
Tooling consolidation: Move away from loosely integrated point solutions to a single platform for both experimentation and analytics data, eliminating data silos and avoiding egress post-experimentation.
Cost savings: Benefit from better, consolidated licensing terms. Read our blog on analytics platform pricing to learn more about comparing pricing across vendors.
For startups: The ideal starting point towards becoming data-oriented
Product Analytics isn't only for large companies with hundreds of millions of active users. In reality, Product Analytics serves as the perfect foundation for adopting a data-driven culture.
"We use Statsig's Analytics to bring rigor to the decision-making process across every team at Wizehire. Their tools help us quickly figure out which features are valuable for employers."
Nick Carneiro, CTO, Wizehire
For companies embarking on this journey, Statsig helps you with:
Starting to log events of interest: Define a library of core metrics for your company, establishing a centralized source of truth.
Creating democratized access to insights: Ensure everyone across teams can self-serve to make informed decisions.
Building a process for tracking dashboards during daily/weekly readouts: Track progress and begin identifying low-hanging fruit.
"It was exciting to see everybody in the team explore metrics and create custom dashboards in no time, completely on their own! Statsig truly democratized data insights and exploration."
Alessio Maffeis, Engineering Manager, Matsmart
Discover how LAAM has been leveraging our Product Analytics over the past year to become a data-driven organization and achieve a 75% growth in conversions.
The modern Product Analytics toolkit
At a high level, our Product Analytics now boasts 5 core capabilities, and we’re committed to relentlessly expanding these features throughout this year and beyond.
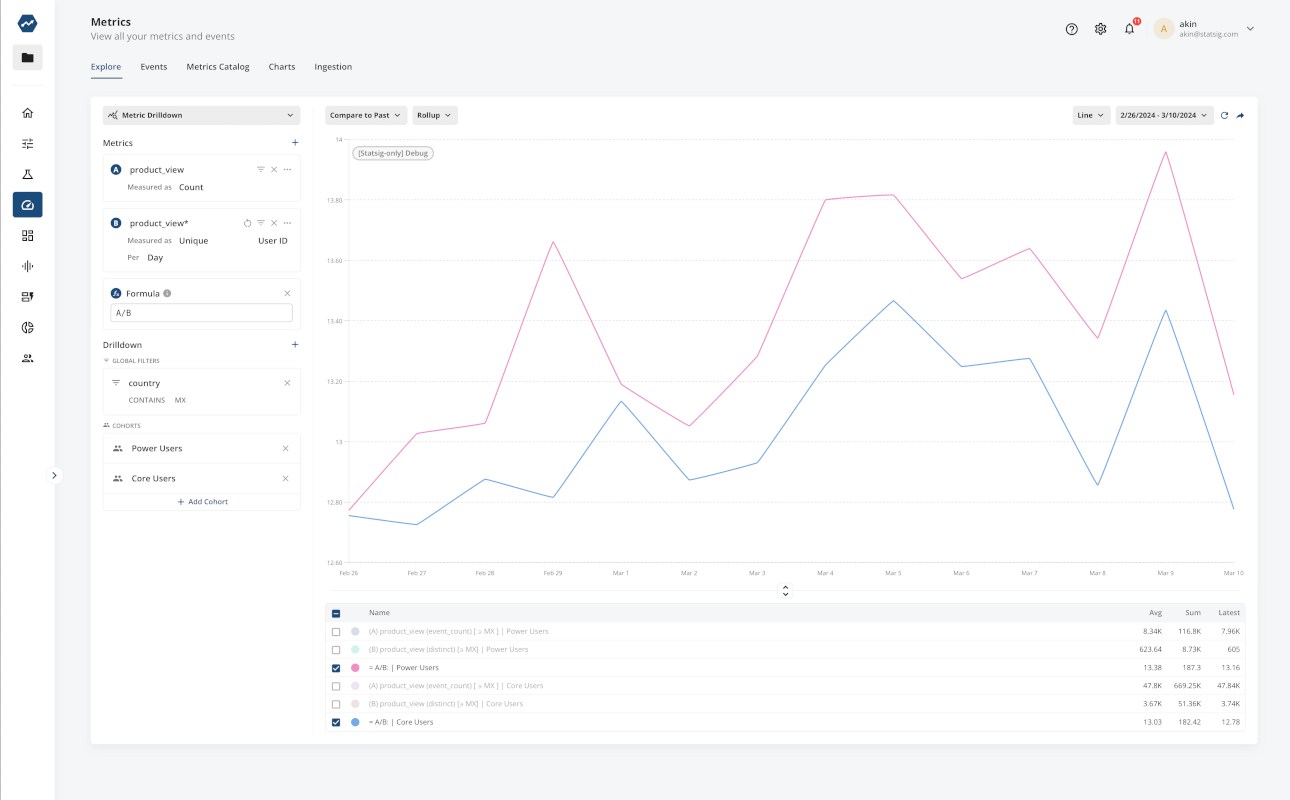
1. Metric Drilldown:
This allows you to explore your data comprehensively, from observing broader trends to zooming into specific events of interest. For instance, you can analyze how the product page views differ between power users and core users.
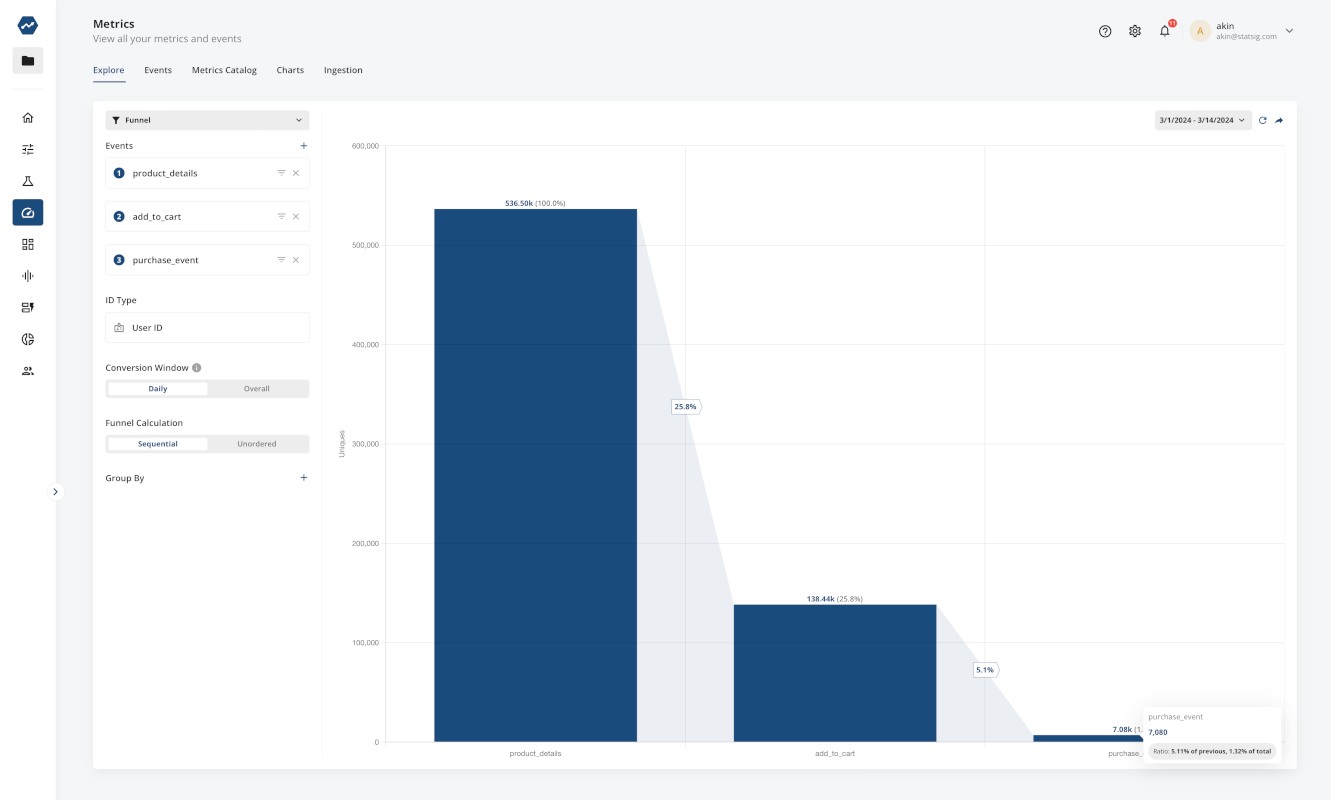
2. Funnels
Gain insights into user progression through critical product flows and pinpoint exact drop-off points. Determine which step in the onboarding or checkout process you should concentrate your efforts on.
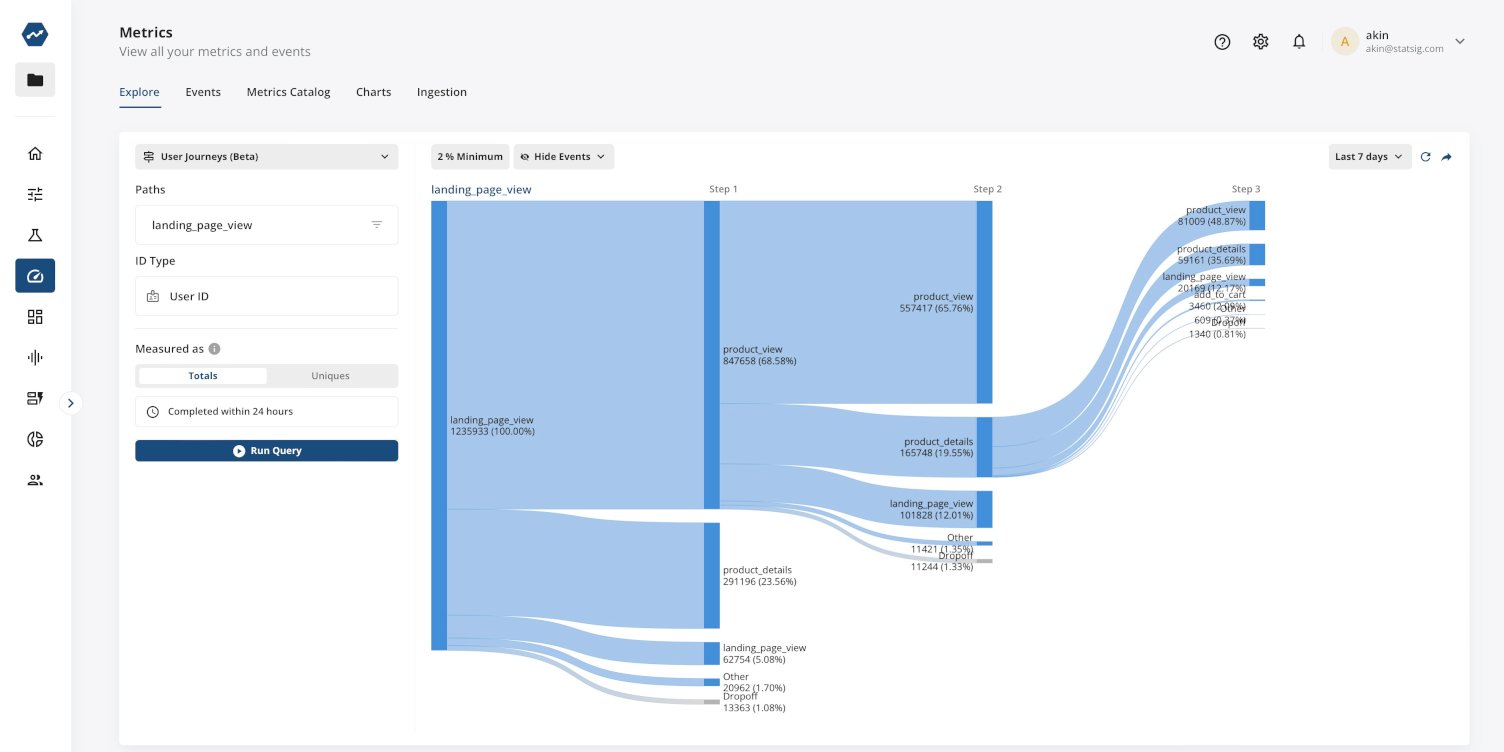
3. User Journeys
Investigate the actual paths users navigate through your product to spot patterns and enhance the user experience (UX).
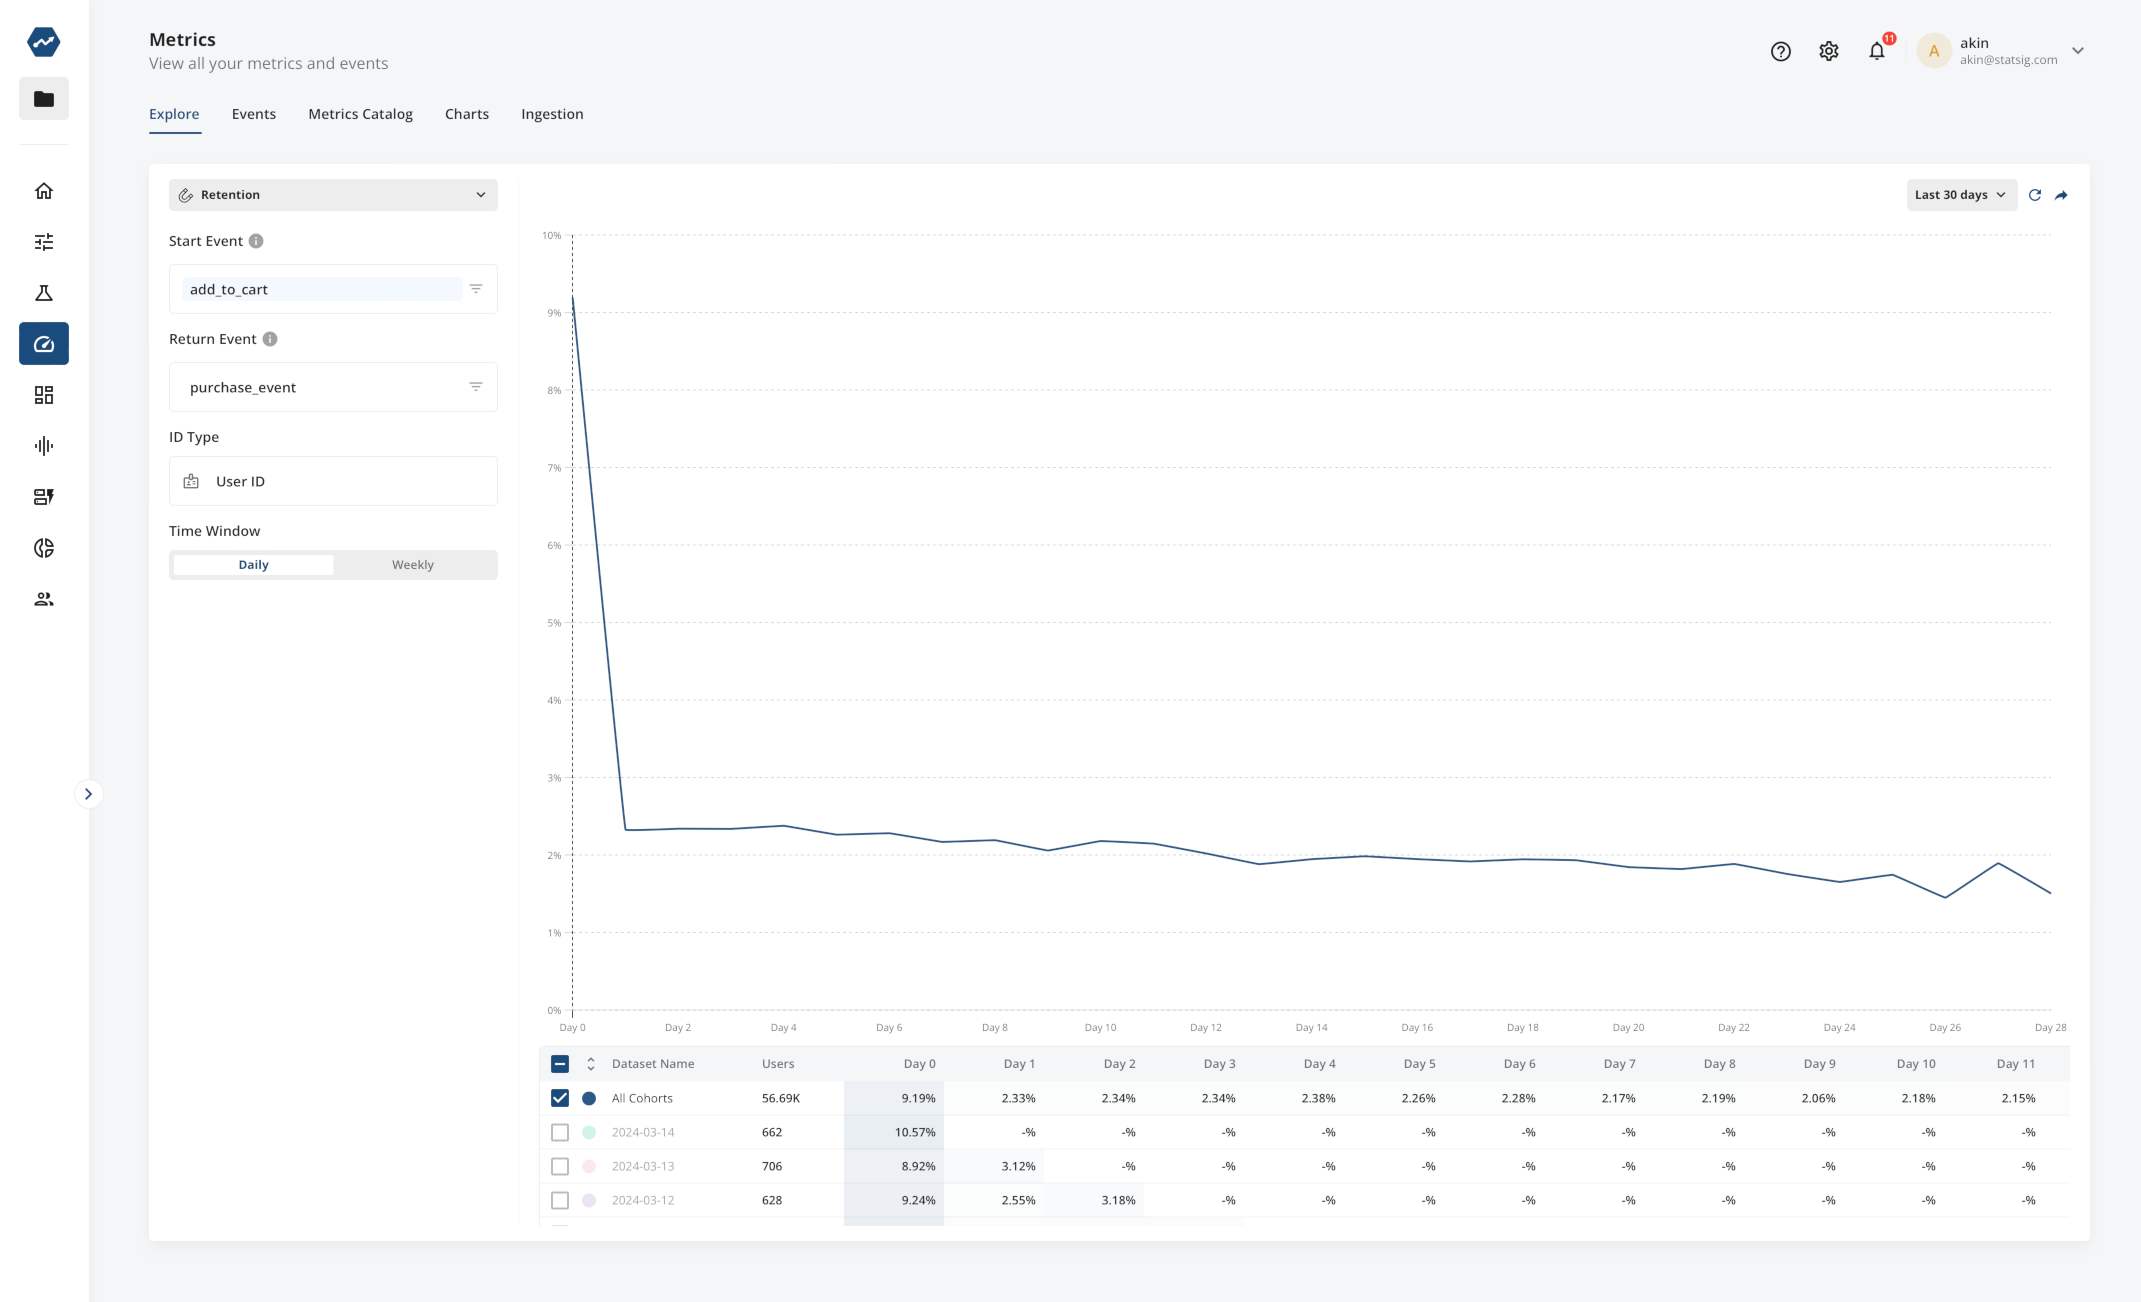
4. Retention
This tool lets you measure retention rates between any two steps, providing a clearer picture of user behavior following their initial engagement.
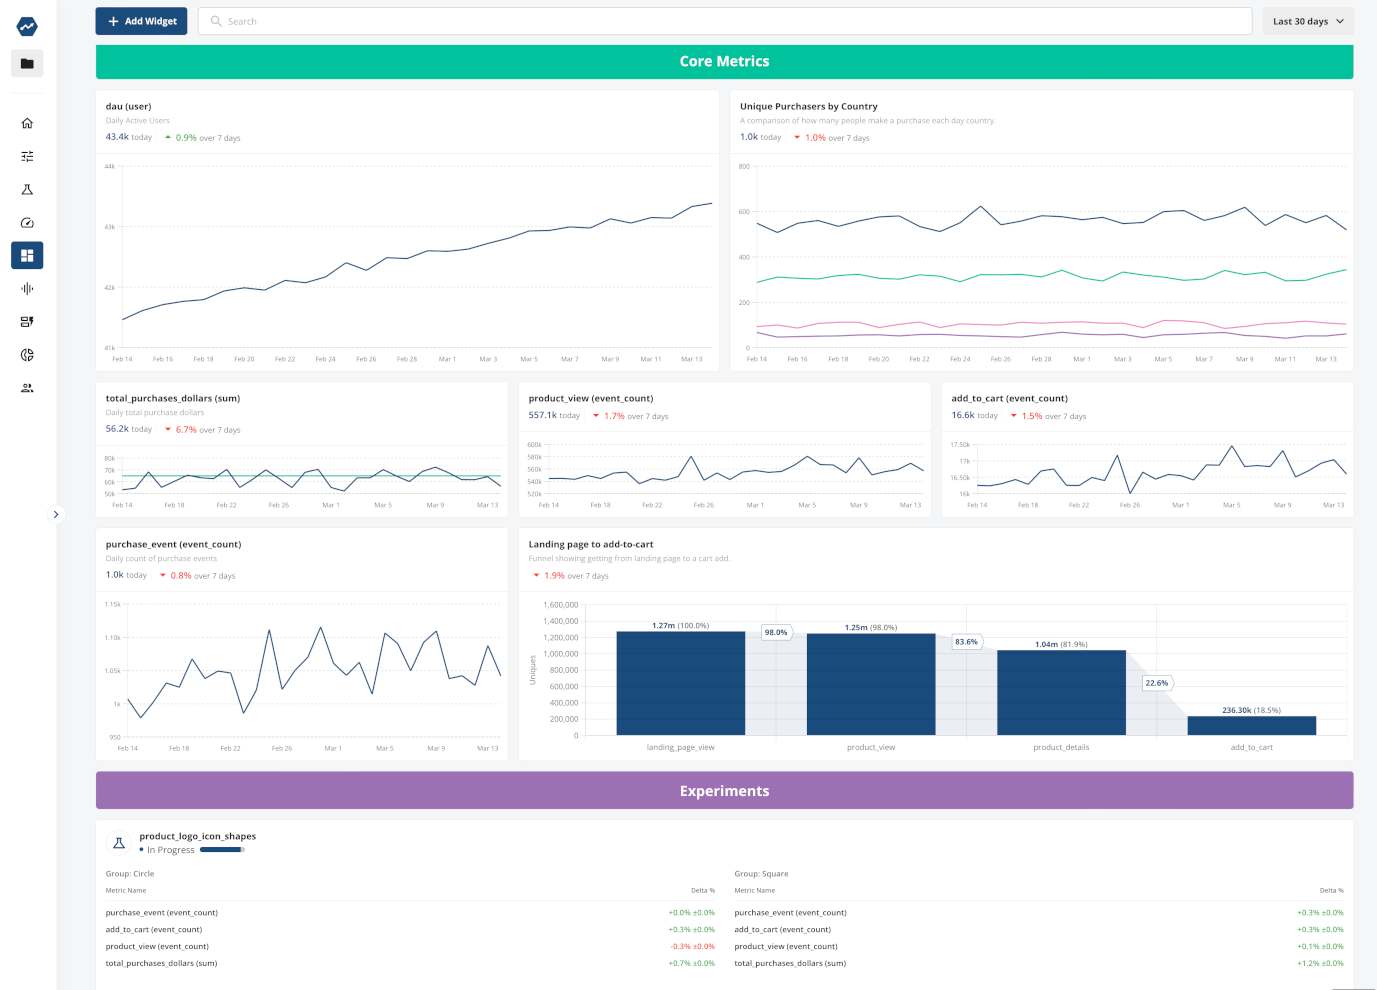
5. Dashboards
Provide everyone in the organization with the ability to easily visualize any metric of interest, empowering all team members to track metrics and make data-driven decisions.
Focused efforts drive massive impact
We've observed that as customers increase their experimentation velocity, their largest wins occur when they know precisely where to focus their efforts.
Cider decreased friction for first-time shoppers with a 'one-time code,' leading to a 20% increase in new user registrations; Notion experimented with various onboarding features, resulting in a 6% boost in Activation; Lime enhanced the New Rider experience by improving onboarding tutorials, which reduced refunds by 20%.
While experimentation assists in identifying the winning feature or experience, data-driven insights enabled these product teams to prioritize their efforts and develop creative ideas they could then test.
With Statsig Product Analytics, we hope to provide such insights that unlock growth opportunities for all our customers.
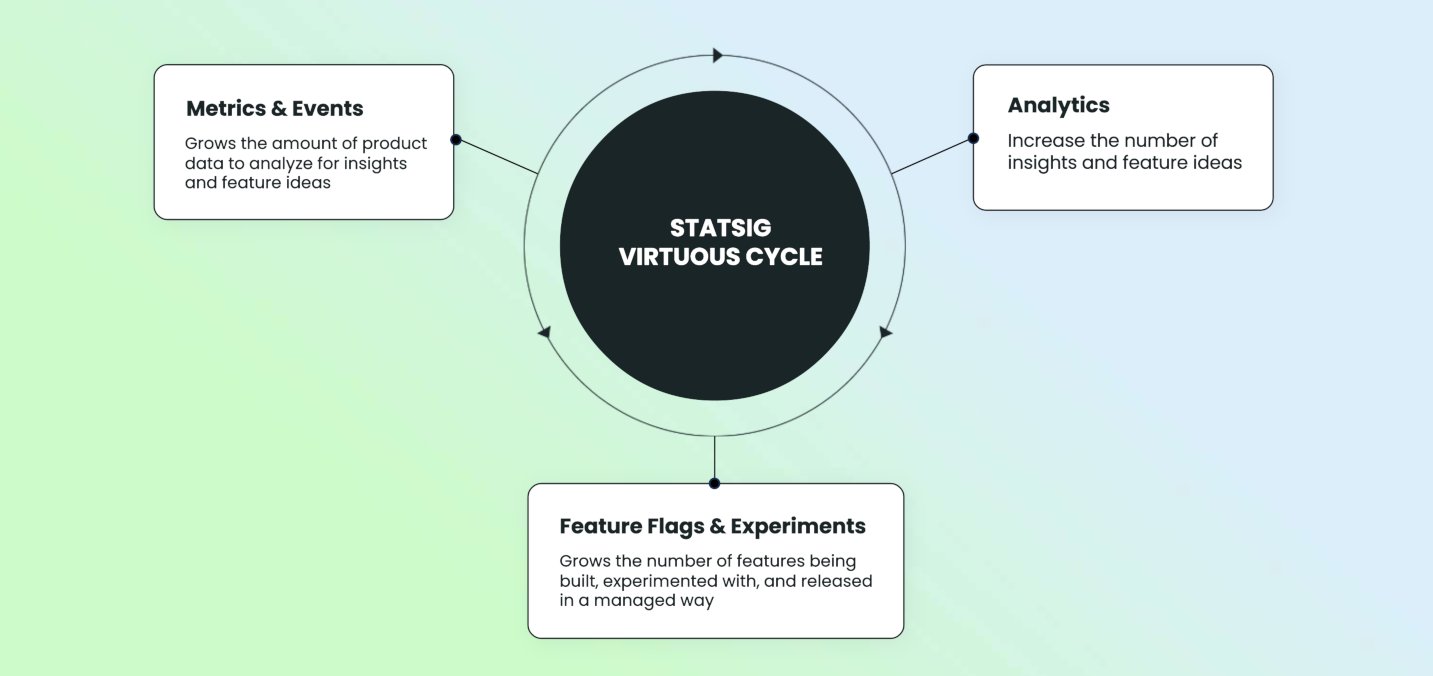
The Statsig virtuous cycle
Product Analytics is a pivotal element of the Statsig virtuous cycle. In this process, you continuously analyze metrics to uncover new growth opportunities. This cycle involves developing and testing a spectrum of ideas, launching successful features that positively influence metrics, and in turn, generating more data and insights to fuel future innovation.
Customers who are already using Statsig for feature flagging and experimentation will find that Product Analytics integrates seamlessly into their existing workflows. And those new to Statsig will find that Product Analytics provides a solid starting point for unlocking the potential of your data.
Get started now!
