The general concept of “observability” has been around for a long time.
The idea originated in Control Theory—a field of control engineering and applied mathematics that deals with the control of dynamical systems in engineered processes and machines.
“Observability” was the idea that you could understand the internal state of a system (i.e., the function of its internal processes) purely by observing external outputs. This idea became a foundational part of how practical people manage complex systems.
Observability as we know it really began in the 1980s when software and computer engineers began to build highly complex computing systems at a massive scale. The easiest and best way to monitor the performance of a system was to identify key outputs and log these outputs.
By tracking these outputs persistently—and sometimes summarizing them into metrics—engineers could monitor the performance of a system, catch errors, and drive continuous performance improvement.
Software development grew even more complex in the 2000s, with the rise of practices like CI/CD, the proliferation of microservices, and the rise of distributed architectures. As deployment frequencies increased, so did the need for real-time monitoring and alerting.
Traditional monitoring tools, which were more reactive in nature, struggled to provide a clear picture of these environments. The need shifted from just monitoring (knowing something is wrong) to observability (understanding why something is wrong). In response, internal tools for for logging, metrics, and tracing (often called the "three pillars" of observability) became more sophisticated, and a new ecosystem of tools sprung up in response.
Companies like Datadog, Honeycomb, and New Relic were created in response to these challenges and have defined the modern Observability category. They focused on enabling all the components of observability across disparate systems, services, and deployments, giving engineers the ability to explore data, understand system states, and troubleshoot issues more effectively.
But these platforms are still largely focused on fixing infrastructure issues within software systems. They are also primarily used reactively; i,e., people use them to find what went wrong vs. identify things that went well.
At Statsig, we believe that product teams need observability tools of their own, which are purpose-built for their work. These tools should combine all the depth and granularity of traditional observability systems with better tools for identifying what works and measuring holistic impact.
These tools are the future of product observability.
What is product observability?
Product observability is a proactive, adaptive, and continuous approach to measuring the impact of what you build, and leveraging that data for future builds. This approach relies on a comprehensive set of tools and practices to measure, learn, and build.
The baseline of product observability is measurement: A product observability platform should have all the features of a traditional observability platform, including logging, tracing, and metrics.

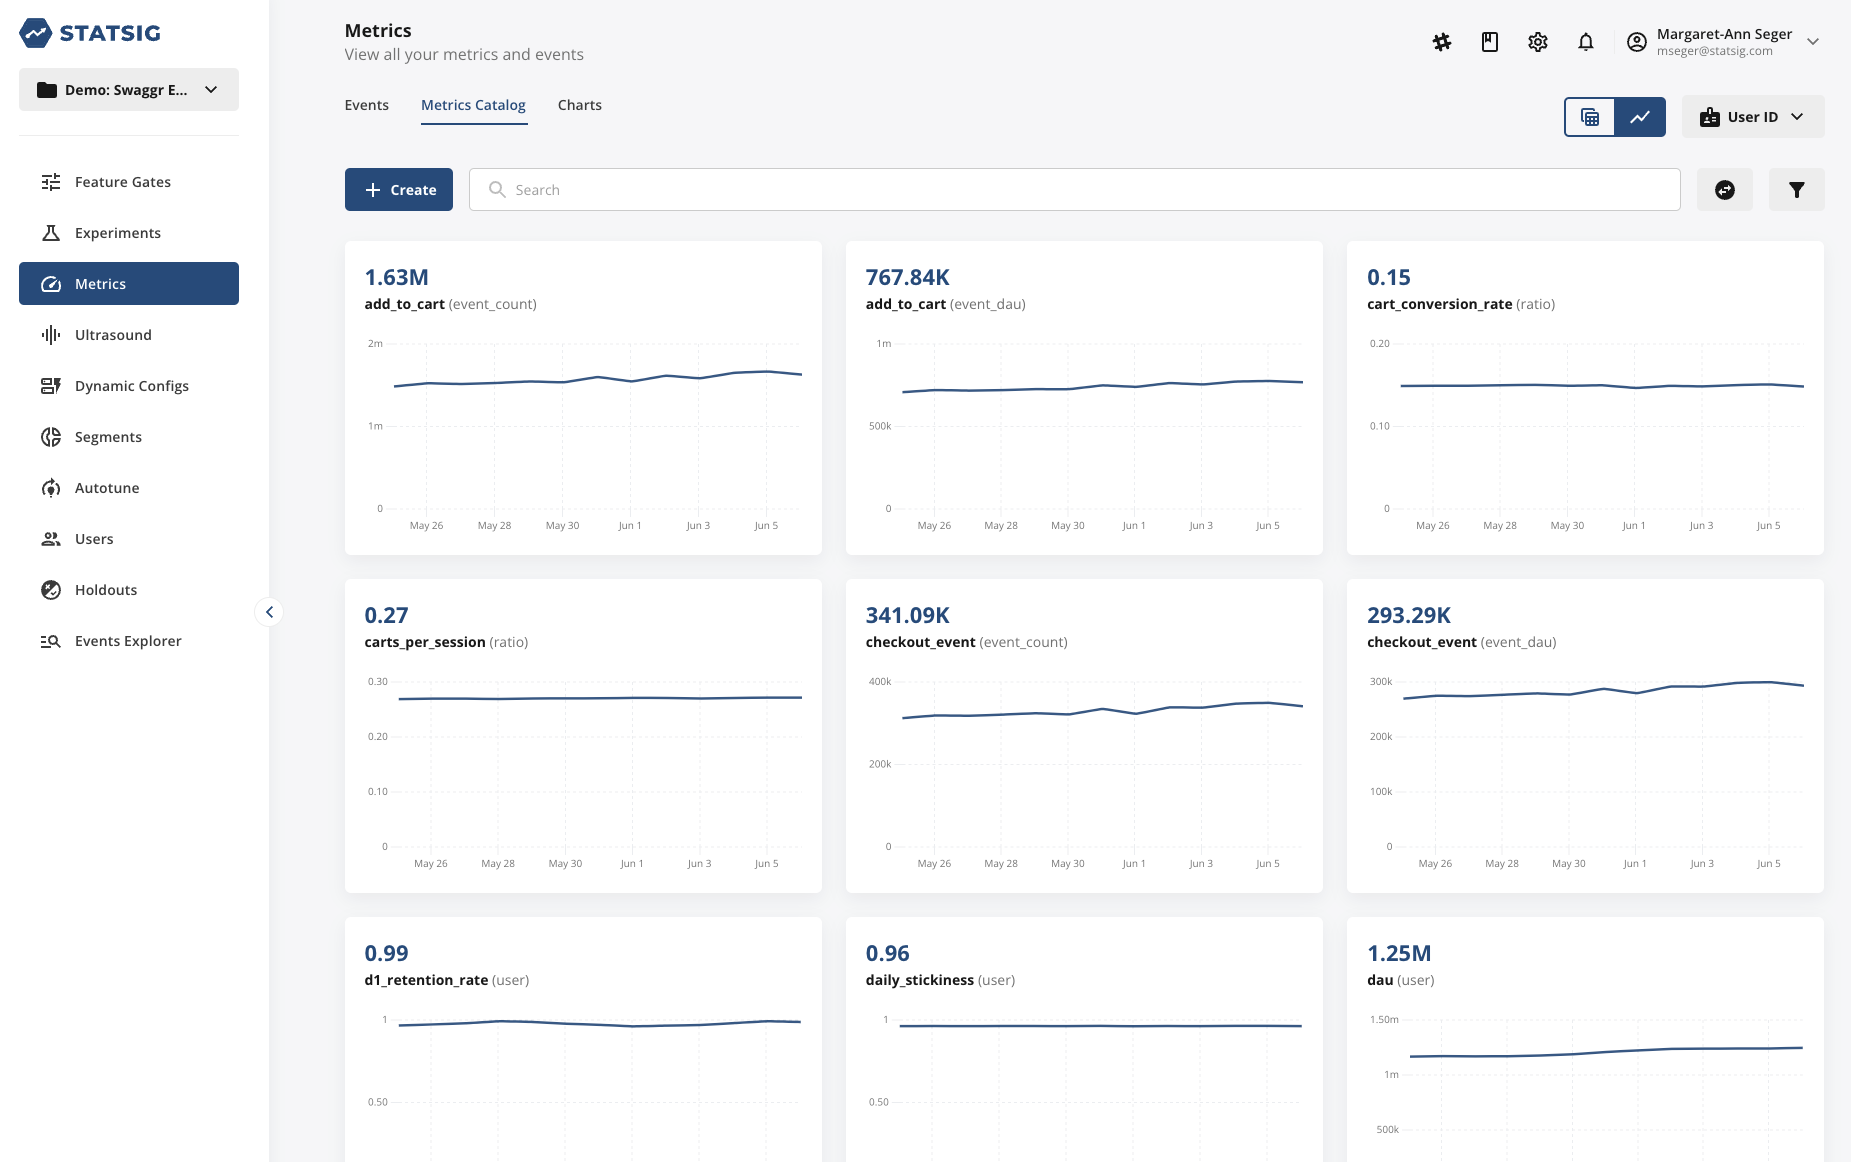
These features should be purpose-built for a product use case, so it’s easy to establish a complete catalog of performance, product, and business metrics. Persistent monitoring of all key product metrics can be a huge unlock on its own, letting your team track the overall direction of your product, catch bugs, and more.
In a product context, top-line metrics aren’t enough for effective measurement. Teams need to be able to break down overall figures based on user characteristics, identify outliers, and dig into the impact of specific features.
Historically, teams have accomplished this with product analytics plus a complete metric catalog, but this is hard to build and maintain, and difficult to combine with other observability tools (like Datadog).
Experimentation is also a very important component of proper measurement of product performance. Experimentation allows teams to isolate the impact of a single change on the performance of a complex system, which is essential if teams want to quantify the impact of the changes that they’re making.
Simply looking at "before and after" impact of big releases can be misleading because there are often many things changing at the same team.
Today, few platforms combine all of these features in one place, with a single metrics catalog.

Next, teams need to learn from these insights: It’s not enough for individuals to see the impact of a release. They need to be able to communicate it to a broader organization to change future behavior.
This is where tools like comments, discussion threads, and experiment reviews come in. These processes don’t necessarily need to take place within the same platform, but it’s nice if they do.
Finally, teams need to be able to build using these insights.
Building new features is hard, but a great set of tools can make it easier. Tools like feature flags and dynamic configs reduce the risk of releasing features, making it easier for teams to build quickly. Great SDKs make the implementation of feature flags, experiments, and event logging a lot easier.
This complete platform is what “product observability” means to us at Statsig. We’re still on the path toward fully realizing this vision, but it’s what drives our product roadmap.
We believe that in a few years, this type of platform will be as ubiquitous as current observability platforms.
Join the Slack community

What are the benefits of product observability?
While traditional observability focuses on system health and performance, product observability emphasizes understanding how users interact with a product, and how those interactions correlate with system behavior.
This is especially crucial in modern software development, where rapid iteration and user-centered design are paramount. Here's how product observability can deliver significant benefits to a team:
Informed decision making
With a holistic view of product metrics, teams get a clearer understanding of user behavior, preferences, and pain points. This means decisions about what to build, improve, or retire are based on data, not just hunches. It reduces the risks associated with product changes and can lead to more effective iterations.
Faster iteration cycles
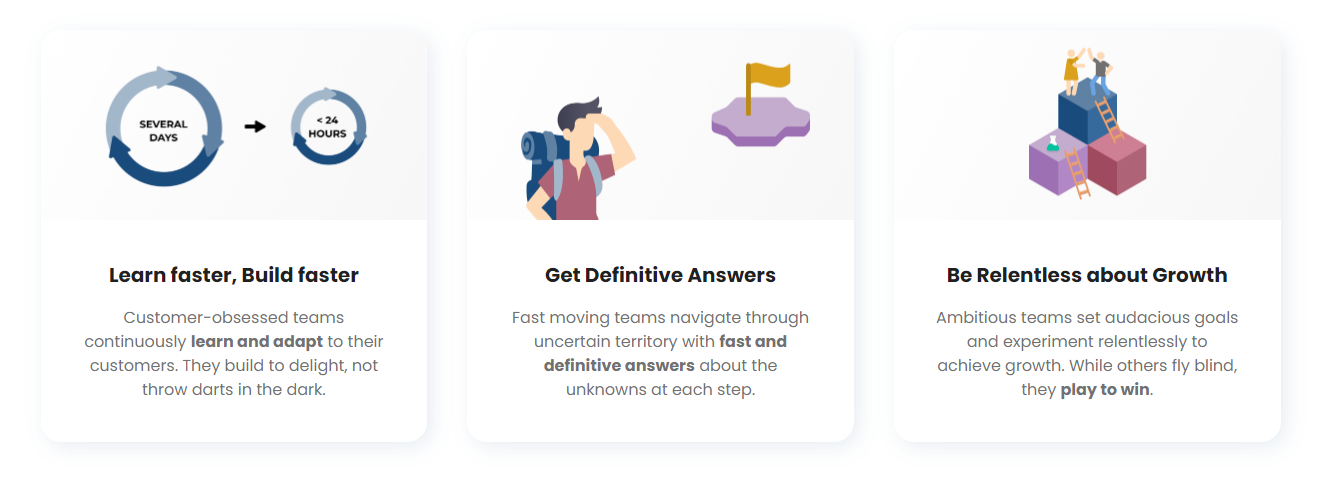
The build/measure/learn feedback loop is central to continuous delivery. Product observability shortens this loop by providing immediate feedback on how changes affect user behavior and product performance. Faster feedback means faster iterations, enabling teams to quickly refine or pivot their approach.
Reduced errors
By closely observing how features and changes impact user behavior and system performance, teams can quickly spot and rectify mistakes. This can be anything from usability issues to performance regressions, ensuring that users have a seamless experience.
Amplifying winning features
When a new feature resonates with users, product observability helps teams understand why. This knowledge can be used to further enhance that feature, promote it more prominently, or apply the learnings to other areas of the product. The result is a compounding effect where successes are rapidly built upon.
Enhanced collaboration
Product observability breaks down silos between development, operations, and product teams. When everyone has access to the same data and insights, it fosters a more collaborative environment, leading to better product outcomes.
Continuously optimizing
Product observability is more than just a set of tools or practices. It represents a shift in mindset towards a more user-centric, data-informed approach to software development and operations.
Teams that adopt product observability stand to gain not just in terms of product quality and user satisfaction but also in agility, efficiency, and overall product success.
The best tech companies already have a full system for product observability. In a few years, we believe that almost every company will too.
Introducing Product Analytics


