Products
Solutions
Resources


Semantic layers act as a bridge between raw data and business users, translating complex data structures into understandable and usable commodities.
As with most best practices, the power of a semantic layer is amplified when used in conjunction with Statsig.
This post aims to shed light on the relationship between a semantic layer and experimentation, exploring the intricacies of supporting semantic layers, and how to re-use metrics that are already aggregated/computed in your warehouse and described in the semantic layer—without manually recreating the metric definition in Statsig or needing to recompute/re-aggregate the data.
Whether you're a developer, a product manager, or a data scientist, this post will equip you with the knowledge to better understand and leverage the power of semantic layers alongside experimentation and highlight a continuous integration process into Statsig.
Understanding the challenge
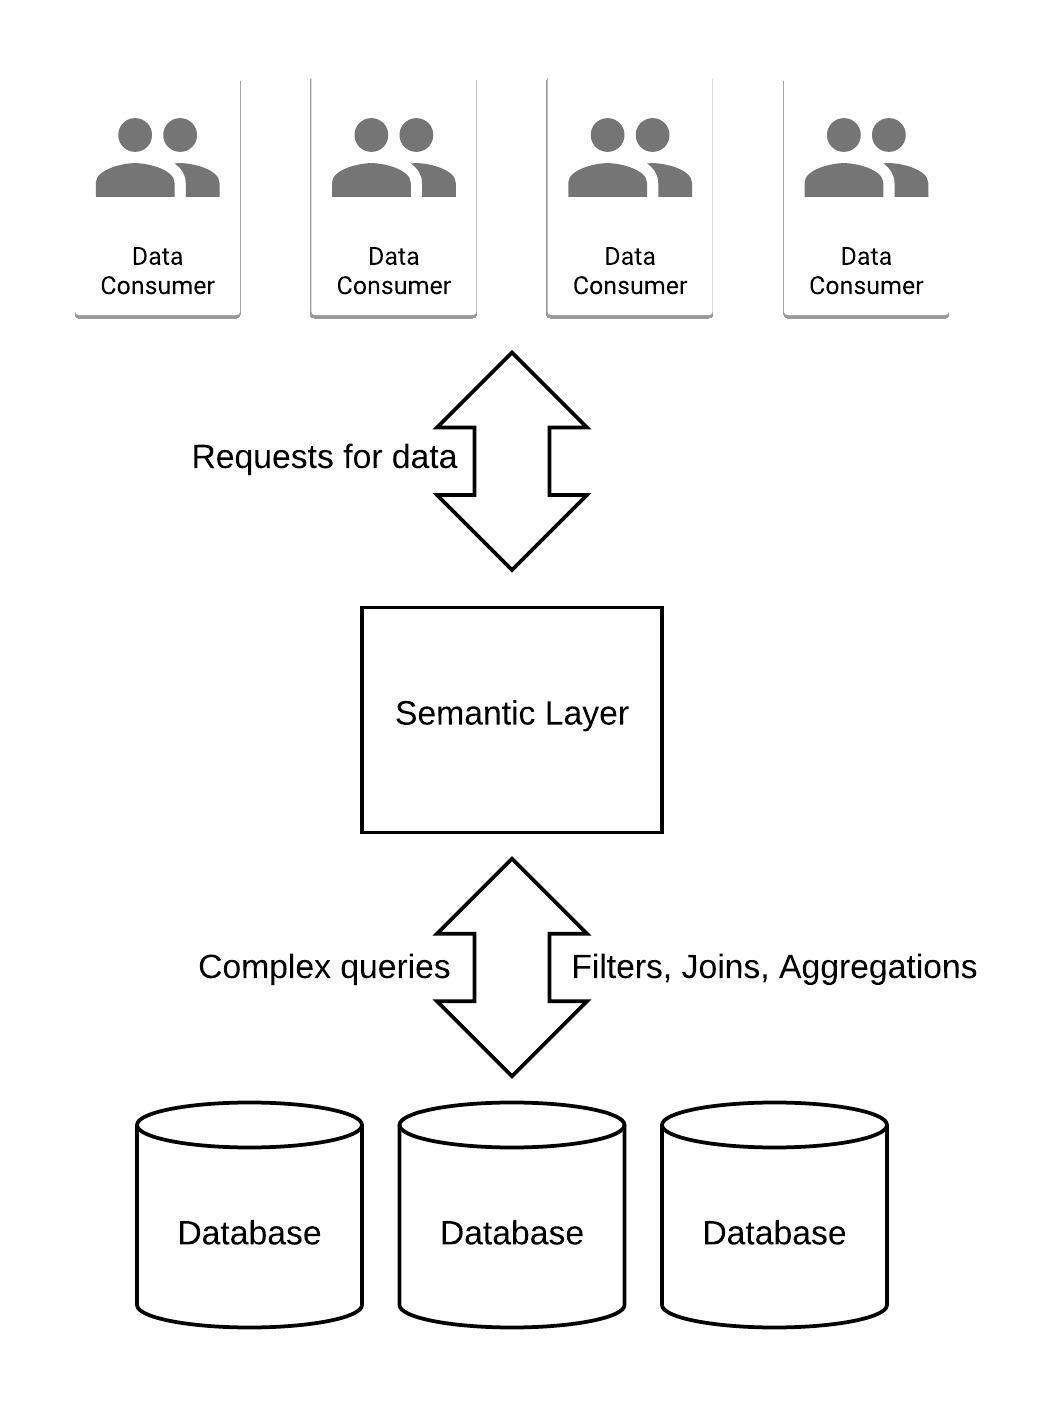
In the realm of data management, raw data is typically stored in various data repositories and subsequently utilized across different platforms such as company dashboards, notebooks, analytics tools, CRMs, internal tools, etc.
This scenario presents a unique challenge: a multitude of data consumers are accessing a few data stores. As a result, individuals often resort to creating their own static versions of the data or crafting their own queries. This approach often leads to inconsistencies and outdated information among data consumers.
A promising solution to this issue is the introduction of a semantic layer.
What is a semantic layer?
The semantic layer serves as a centralized translator, bridging the gap between the data storage and the data consumers.
Centralized version control for metrics ensures that all data consumers are accessing the same, up-to-date information, thereby eliminating inconsistencies and promoting data integrity.
Typically, a semantic layer is a repository of static YAML/SQL files that represent a semantic graph that can be used to query metrics.
Let’s walk through an example:
Semantic layer example
⚠️ This article uses a pseudo example. For comprehensive code, check out our working code in our GitHub repository.
Let’s assume these YAML & SQL files are stored in Github (something like this example from dbt).
These files contain model, measure, and metric definitions. These entities may be represented through a pairing of SQL and YAML files. In an e-commerce example, let’s say we want to build an order_items model, and that would consist of order_items.sql & order_items.yml.
order_items.sql contains the definition of the underlying model. I.e. which raw tables to look at, any necessary joins, appending, filtering, transforming, etc.
order_items.yml would then contain definitions of measure and metrics.
Measures: Aggregations performed on columns in your model. They can be used as final metrics or serve as building blocks for more complex metrics.
Metrics: Quantitative assessments commonly used for viewing, comparing, and tracking performance, production, engagement, etc.
Some businesses may actually materialize the outputs of this transformed data into a data store or a caching layer, and route data consumer requests towards the materialized table or cache. But some businesses mostly generate the data on the fly.
In general, leveraging a semantic layer to supply metrics for your experimentation program can help with:
De-duplication of metric storage and compute
Consistency and accuracy of data
Simplifying data management
Providing a layer of abstraction between users and raw data
Improve data accessibility, enabling non-technical users to easily understand and use data for experimentation
Real-world semantic layer use cases:
Integrate Airflow with either dbt or Cube so that Airflow can execute jobs using semantic layer definitions or push changes from upstream data sources.
Hightouch & dbt integrate to reverse ETL data through your semantic models, even though they may never materialize as tables/views in the warehouse.
Tableau & Cube integrate to import metric definitions, ensuring they are consistent and reliable for business reporting.
dbt & Mode integrate to make your most important company metrics automatically available to business teams for confident data exploration and self-serve reporting.
Integrating a semantic layer with Statsig
Continuing with our example above, if we want to integrate our semantic layer and metric definitions from Github into Statsig, we can create a GitHub Action that automates the process of parsing a yaml file in GitHub and syncing these models, measures and metrics into Statsig.
The action is simple; It parses a yaml file from GitHub, checks if the model (or metric source) exists in Statsig, and creates it if it doesn't exist. It then checks if the metric exists in Statsig, creates it if it doesn't, or updates it if it does.
Join the Slack community

Creating the GitHub action workflow
To create a GitHub action workflow, first create a new file in your .github/workflows directory and name it statsig-metrics.yml. This file will define your GitHub Action workflow.
This workflow triggers whenever a push event that modifies a .yml file occurs. It then runs a Python script that handles the parsing and updating of metrics in Statsig.
Creating the Python script for updating metrics
Create a new Python script in your scripts directory and name it update_metrics.py. This script will read your .yml files and interact with the Statsig Console API to create metric sources and metrics.
The winning strategy
At Statsig, we’re proponents of being able to map your business data into a unified, consolidated view. To that end, the Statsig platform will allow you to do exactly this. You shouldn’t have to worry about duplicate data and storage, or exporting your data just so that other teams can make sense of it.
Our customers have shown us that unifying the team under one platform actually creates a gold-standard culture of experimentation, where everything is an experiment and all metrics are tracked and optimized. Using a semantic layer is a great way to help affect this change.
Get started now!
