Products
Solutions
Resources


At the end of 2022, Statsig was almost two years old.
Looking back, we moved pretty fast in that timespan. By the end of year 2, our team built our core product (the gold standard for hosted experimentation) and started to serve hundreds of companies at a massive scale—including Flipkart, Brex, Notion, Whatnot, OfferUp, Headspace, and many more.
When 2023 started, we felt really good about our progress. We had gone from 0→1 and built a product people liked. That was the hard part, right?
We figured that 2023 would look pretty similar to the year before but with a bigger base to build off of. Our roadmap was focused on improving our core experimentation product, scaling our customer base, building out our feature flagging product, and maybe thinking about what product would come next. The word “AI” didn’t really cross our minds.
Well, turns out that we did do all of the things we planned, but we also did so, so much more. Some highlights:
Launching not 1, not 2, but 3 net-new products
Scaling our product to thousands of companies, billions of end users, and trillions of events
Helping the best AI companies in the world deploy & improve their products
Building our own AI tools & features
Making continued improvements to our core platform
Expanding our team to 70+ people (plus 2 ping-pong tables)
We’ll cover all these in detail below, but first, we owe a HUGE thank you to everyone who has been a part of our journey. It’s hard to believe we covered so much ground in just a year; that was only possible because of the extraordinary effort and dedication of our team, the trust of our customers, and the support of our investors.
Statsig Warehouse Native
In June, we had the biggest launch of the year: Statsig Warehouse Native.
Warehouse Native brings our stats engine to a customer’s data warehouse, letting them use their existing data to analyze experiments.
This has been a fast-growing product area and unlocked new features customers have asked us for previously, like the ability to stitch IDs across a logged-out and logged-in session.
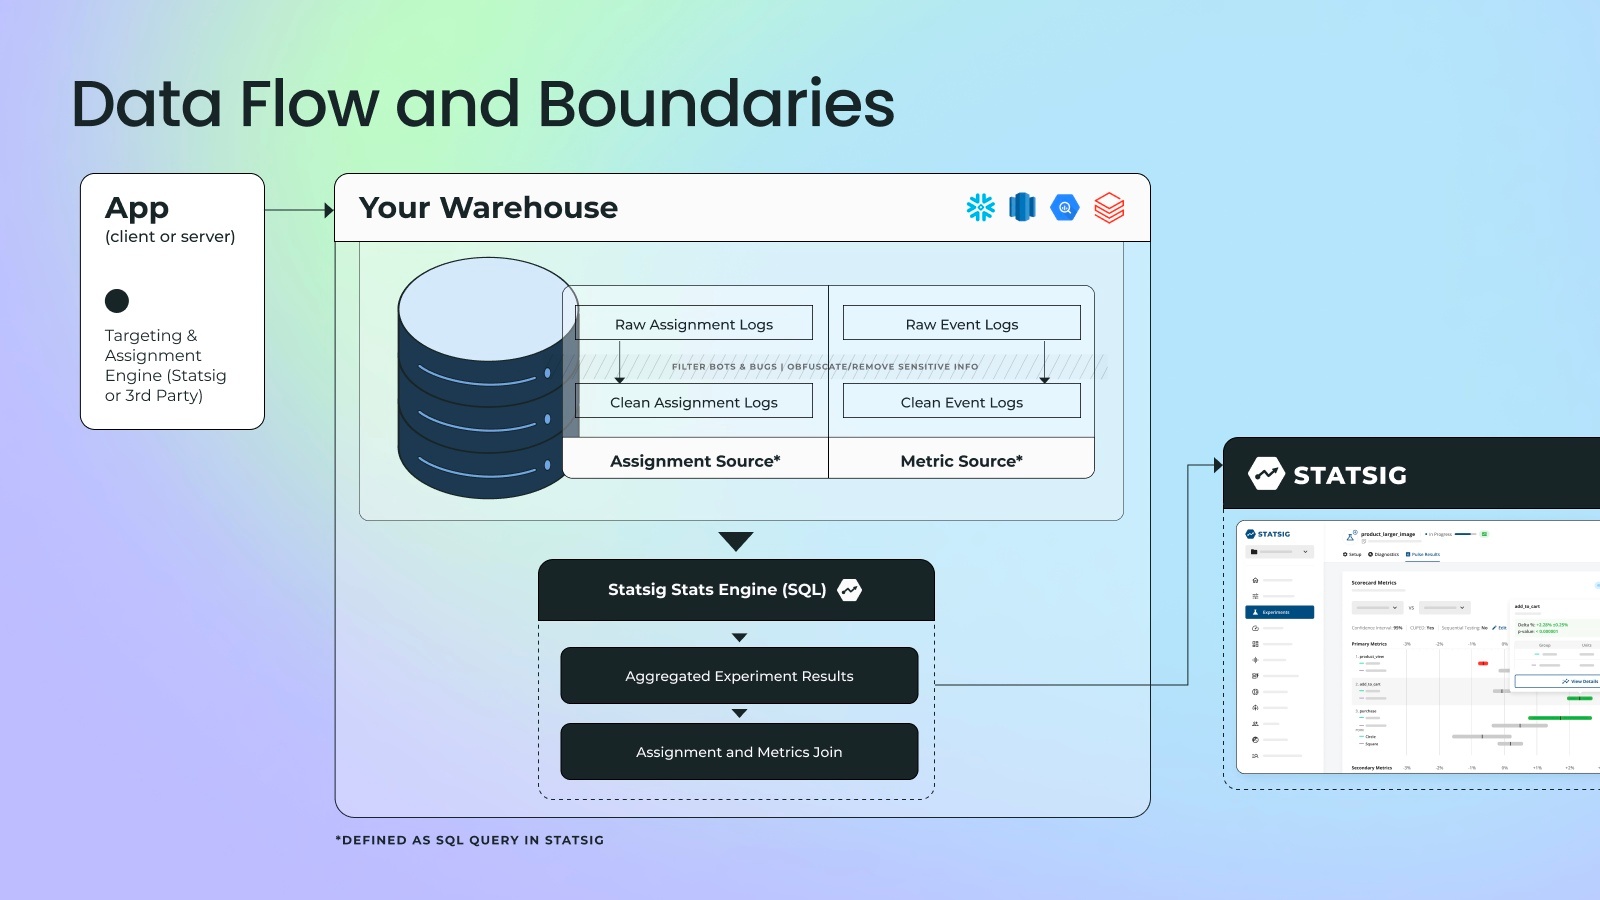
Customers have loved Warehouse Native because it helps their data team accelerate experimentation without giving up control. If they already have clean data, data science teams can fully automate experiment analysis in minutes.
When combined with Statsig SDKs, Warehouse Native is also a fully featured way to use Statsig without sending user-level event data out of your warehouse. This is a huge unlock for our customers with strict data privacy requirements.
Free feature flags for all
In February, we announced that we were introducing free feature flags for all. This was our first standalone feature flag package and it was very generous; customers could use a generous allowance of non-analytic gate checks for free, forever.
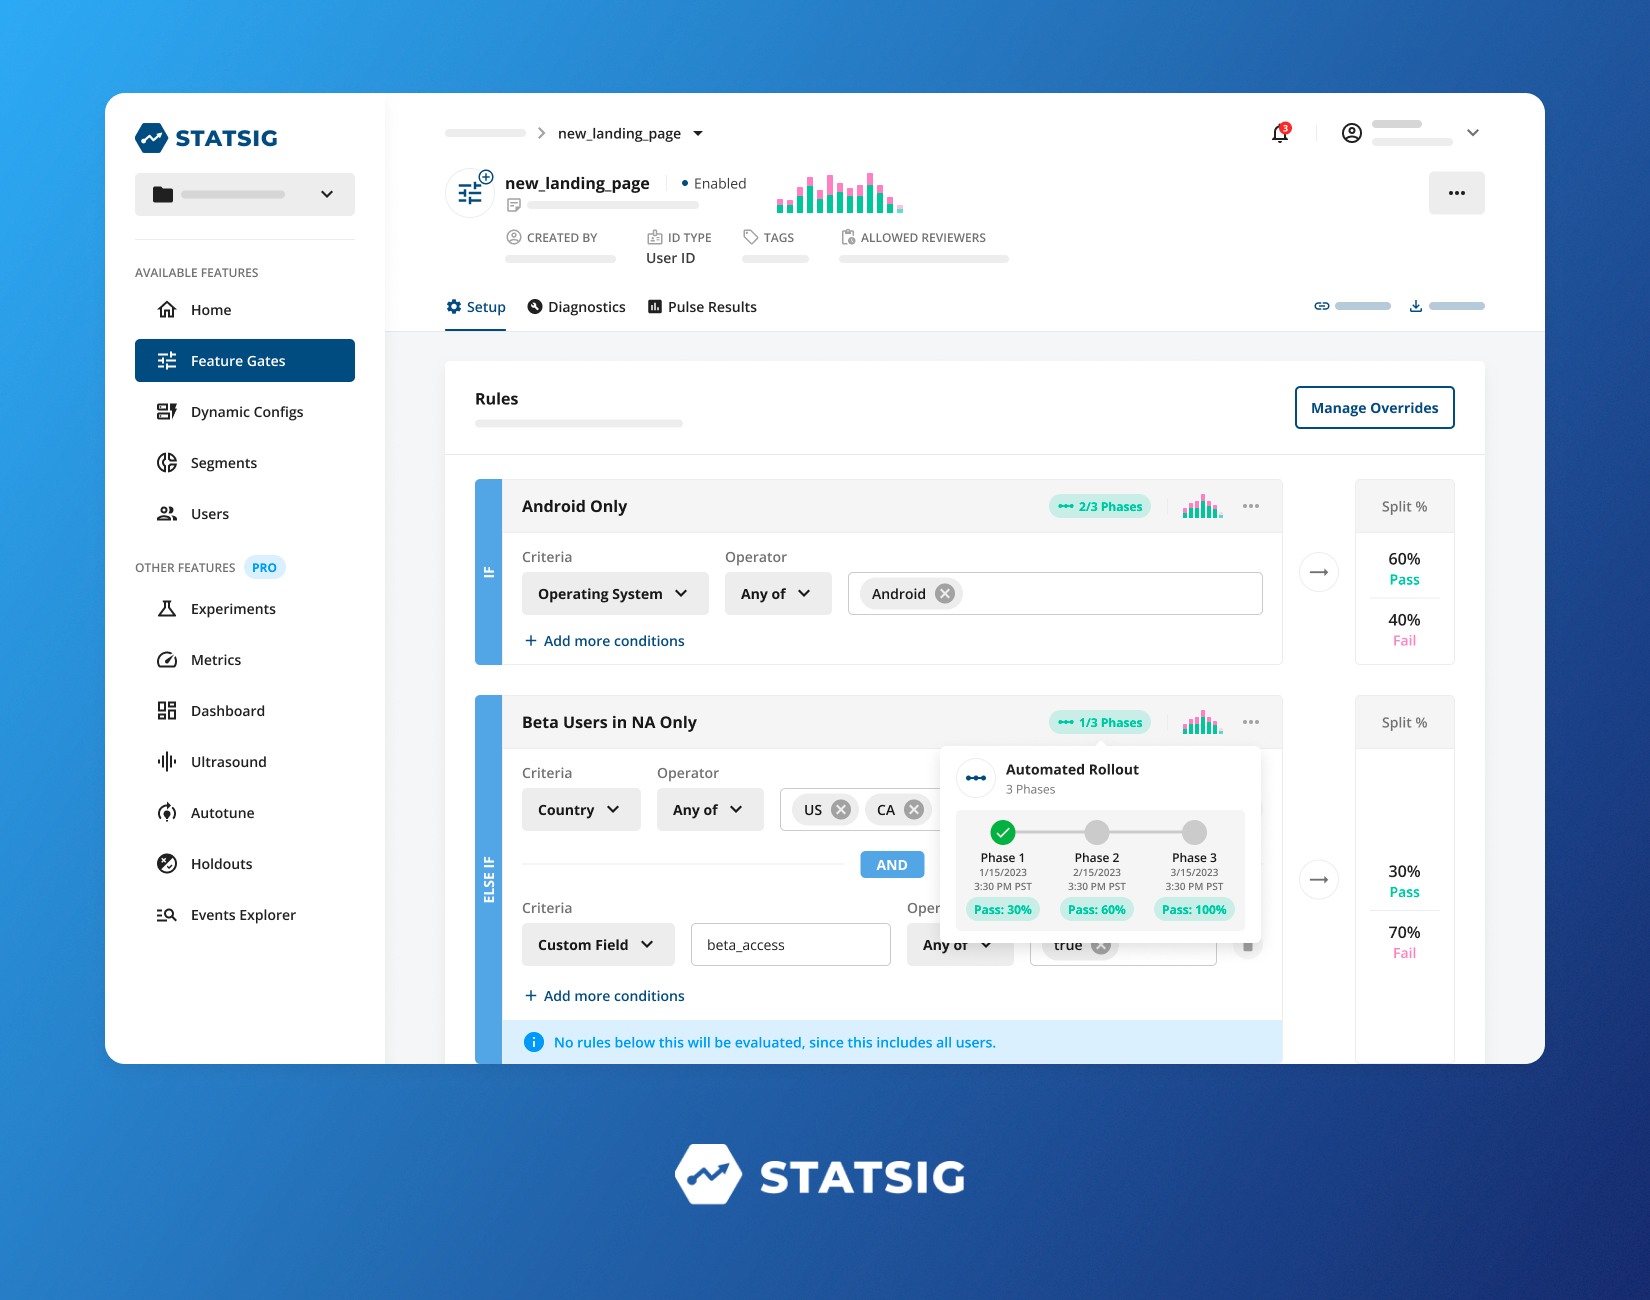
We had hundreds of companies come in to use this package, but over time we realized that it wasn’t quite right. For one thing, customers didn’t know if the allowance of gate checks were enough for them. For another, we didn’t want to force customers who needed experimentation or product analytics to change plans.
So in October, we made our developer tier even more generous. We removed the limit on non-analytic gate checks, stopped charging all new developer- and pro-tier customers for non-analytic gate checks, and threw in experimentation and analytics too.
Today, any developer-tier customer can use our platform for feature flags for free, plus a lot more.
Introducing product analytics
At the start of 2023, we already had a basic set of product analytics tools. People could create custom metrics, build dashboards to track progress, and do some cross-cuts on metric dimensions. These are the sort of things you need to have if you’re an experimentation platform.
Over the last year, our customers continued to ask for more product analytics! They wanted to be able to unpack experiment results, dig into interesting trends, and learn more about user journeys.
We started by improving the functionality of our existing features. The overhaul of Custom Queries is a prime example: We slashed query times from 10-15 minutes to just 2-3 minutes so people could slice and dice experiment results in quick succession. But improving wasn’t enough.
So, in September, we launched our first new product analytics offering: Metrics Explorer.
Today, you can use Statsig to create and visualize your metric trends and dive deeper into specific slices in real-time. Our platform now includes metric drill-downs by user properties, group-level analysis, retention analysis, cohort curves, funnel analysis, and much more.
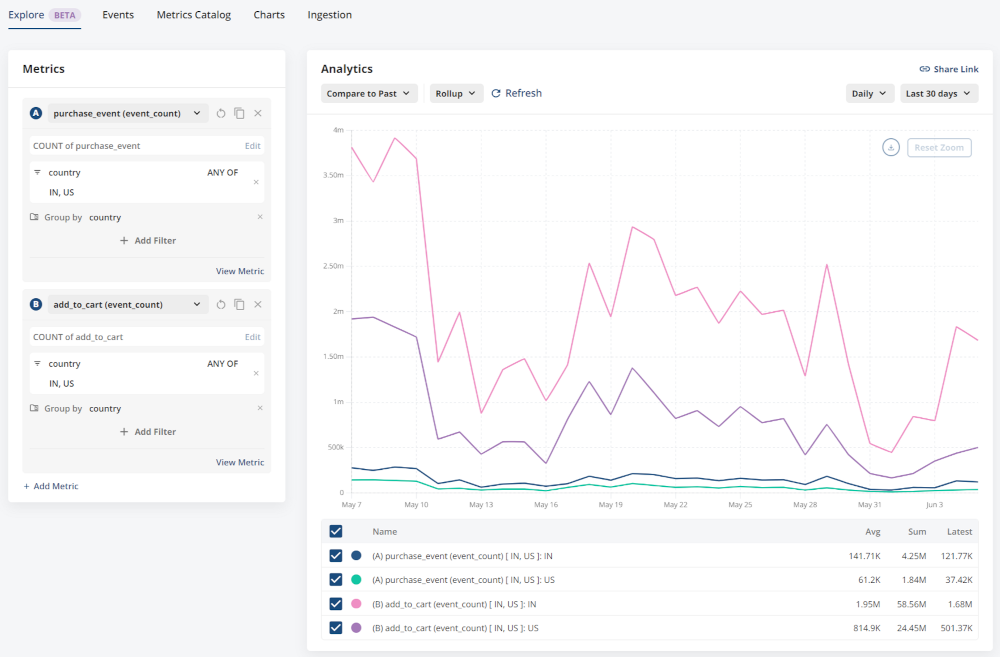
Customers have loved the ability to combine experimentation with product analytics. Using a single metrics catalog for both areas of analysis saves teams time, reduces arguments, and drives more interesting insights.
We’re excited to invest more here in 2024!
Scaling? No problem
We’ve started to hit unbelievable levels of scale with our core product. Some headline numbers:
This month, we delivered experiments to over 2B end users (non-deduplicated, but still…)
This month, we processed over 6T events (that’s 200B per day, or 2.3M every second)
This year, we onboarded over 2000 new customers to our platform
These metrics are multiples of what we did last year. Event volume, in particular, has expanded far faster than we expected. How have we handled this massive increase in scale?
Pretty well! There’s been some heroic work by our data and infra teams to keep everything running, but so far, so good. If we scale at the same rate next year, we’ll deliver experiments to everyone in the world a few times over!
The AI-lephant in the room
It’s impossible to talk about 2023 without talking about AI. While Statsig isn’t an AI-first company, our product was remarkably well-suited to meet the needs of AI product builders.
We couldn’t have imagined all the ways that AI companies are using Statsig to improve their products… but it’s been amazing to see the best AI companies in the world flock to Statsig.
Our favorite use case was model experimentation. It’s such a powerful and important tool for companies building with AI. Instead of wondering which model works better for your product, you can just test them!
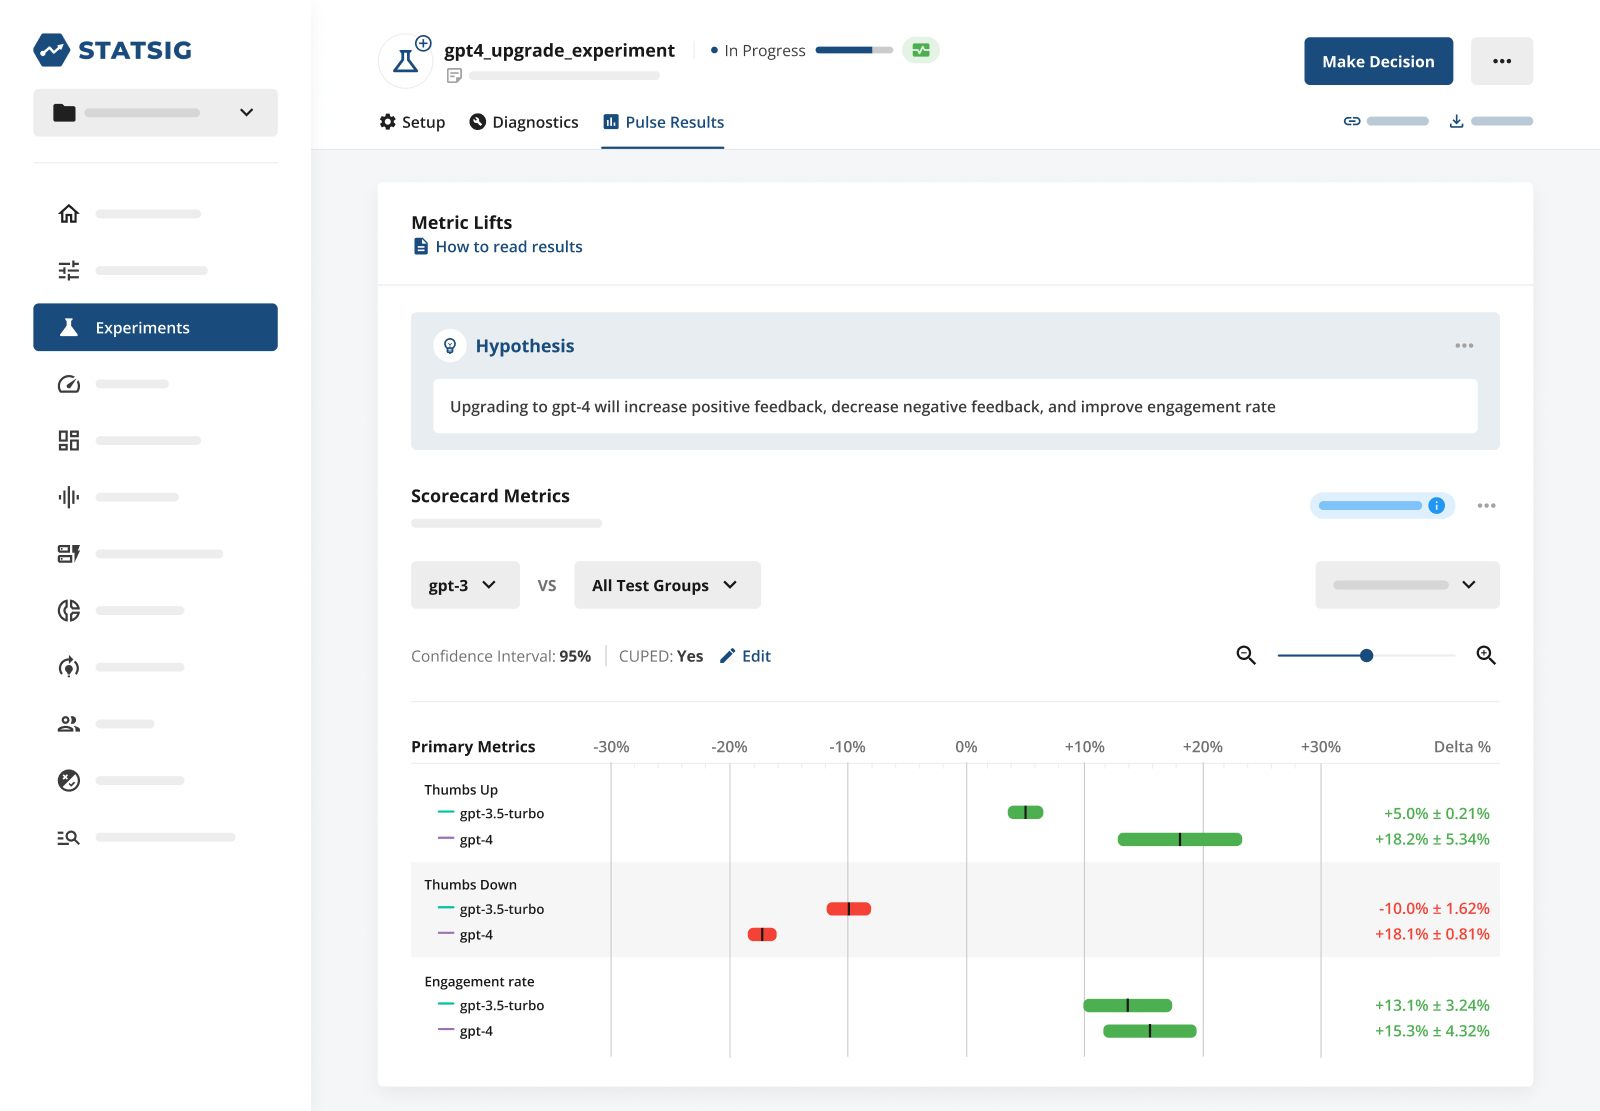
Other use cases are similarly cool; from using feature flags to launch your new product to using layers to experiment on every component of your AI app, there are a lot of ways Statsig helps AI companies grow.
Read our customer stories

Our own AI journey
We’ve been working with AI all year and rigorously documenting our results. Hopefully our findings can help you create AI magic in 2024.
For starters, we created a guide and explanation on how experimentation platforms can use autotune to optimize model temperature for AI applications.
We then created a sample web app in reactJS called Statsaid using OpenAI’s API, and described our experience using Statsig to manage and experiment with model parameters.
⏯️ Watch the webinar: How to optimize AI performance with Statsig.
This web app would ultimately evolve into Statbot, a live AI that assists with user questions about Statsig. In How Statbot AI Saved my Hackathon Project, we took a deep dive into our experience creating a spin-off Glossarybot to provide static definitions of commonly-used experimentation terms as a hackathon project.
Over the summer, we hosted an informative virtual meetup on the topic of how non-AI companies are building AI products, which covered a bunch of angles, including how Notion successfully launched Notion AI. And if videos aren’t your thing, we produced a written version of this content as well.
In June, we partnered with Madrona Venture Group, WhyLabs, and OctoML, to host a Seattle AI meetup. To summarize our blog post recap, we garnered three main takeaways from this event:
AI/ML has been here for a while, but this wave is different due to speed and widespread access.
The current generation of generative AI can produce some seriously cool results due to better models and tools.
We can’t predict how many models there will be, but companies will need tools to deploy models quickly.
For our customers, we wrote a comprehensive primer on how to use Statsig to build AI products, and included real examples from our AI customers. This article covers the role of feature flags, experiments, layers, and analytics, as they pertain to AI development. There’s also a follow-up to this article (featuring a Statbot cameo 🍝) focusing solely on the importance of feature flags for AI products.
Lastly—amused by Google’s relentless attempts to upsell us on AI search—we wrote a recap of Google’s experimentation strategy (including why the CTA banner is always a different color) for its new AI-assisted search product. We wish we had more information about their experimentation setup, but the concept of “red button versus green button” is the most common example of A/B testing, and it was funny to see it coming from Google.
Strengthening our core
Despite all the new launches, we’ve continued to make big improvements to our core product.
You may have heard the phrase “Culture eats strategy for breakfast.” We’ve written about it extensively as it applies to experimentation, and we continue to invest not just in the stats engine backing Statsig but also in the tooling that enables distributed, data-driven decision-making at scale.
This year, we launched an improved Power Analysis Calculator and interactive Experiment Summaries, improving the pre-and-post-experiment process.
We also added the ability to export Experiment Summaries as PDFs, built new Experiment Scorecard views and policy controls, and integrated GitHub Code References, all in an effort to improve collaboration and bring your existing collaboration tools into the experimentation lifecycle.
We build these tools that exist outside the scope of a single experiment and outside the stats engine because, as Sid and MA put it simply, "experimentation is a team sport".
That's not to say we haven’t been hard at work on the core stats engine powering your experiments:
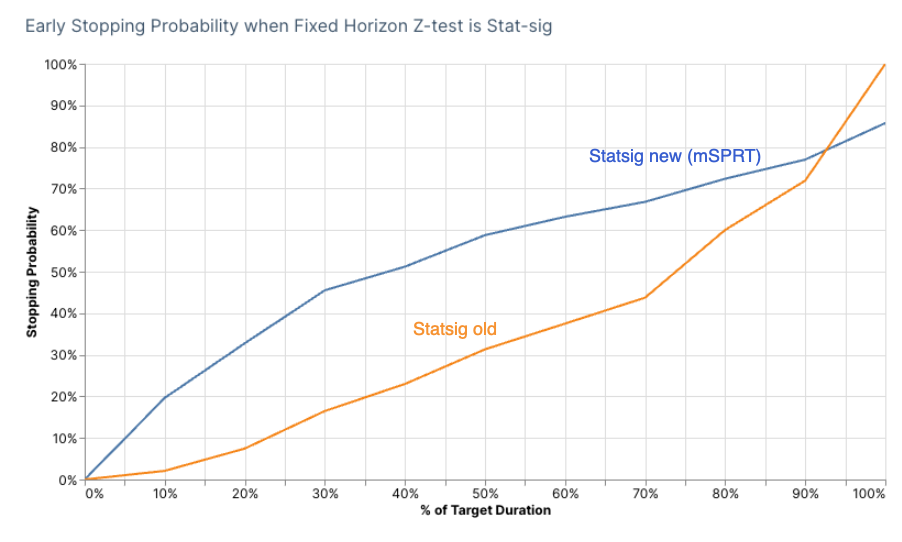
We added support for Bayesian analysis and switchback experiments—two of the top requests by new and existing customers. We revamped our sequential testing methodology as well to improve the ability to detect stat-sig results earlier while maintaining a sub 5% false positive rate.
Bayesian A/B test calculator

A year of ping pong (and team growth)
2023 was the year ping pong took over our office as well. We’ve replaced League of Legends with ping pong tournaments, and it has brought some healthy competition to the office.
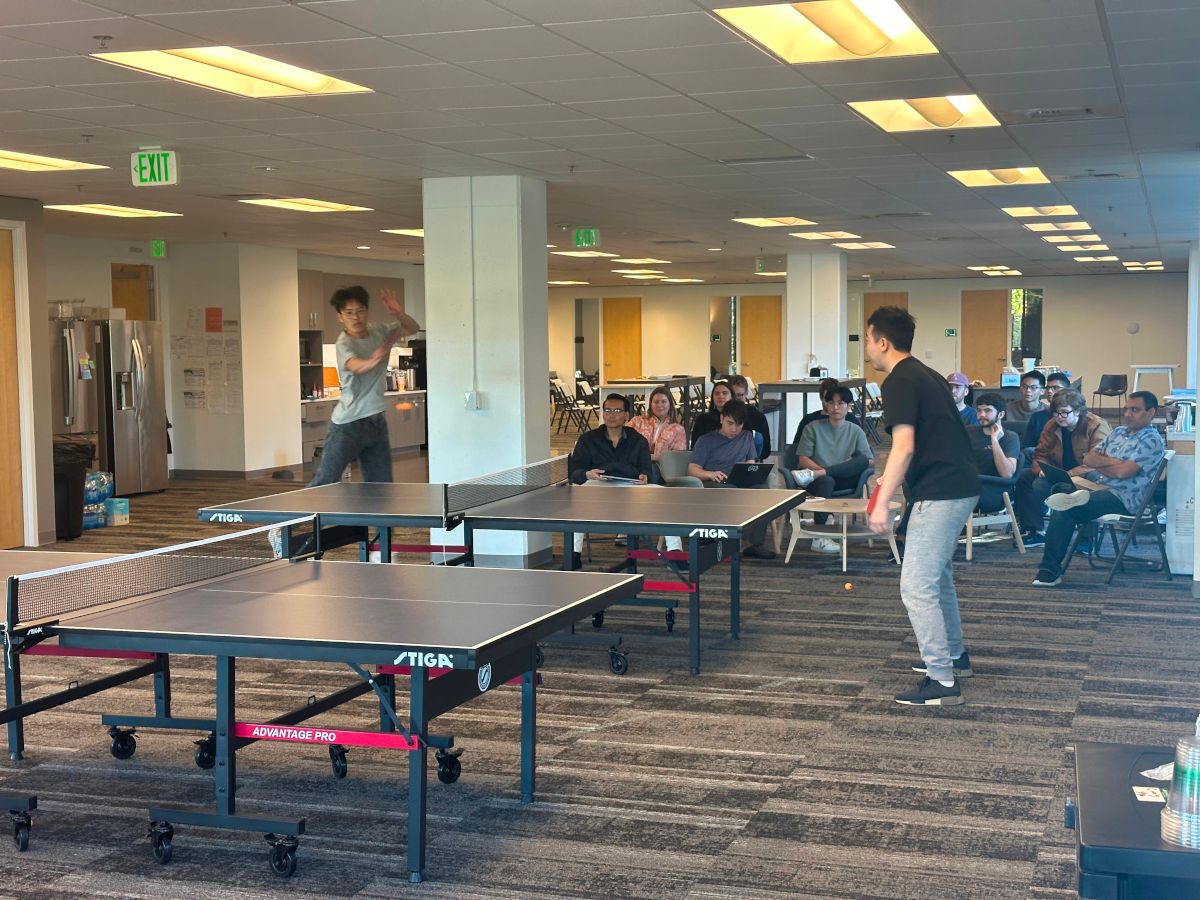
We know return to office is still controversial for some people, but for us, building things and competing in a match of ping pong, while feasible to do virtually, are best done face to face.
We continued to scale the team this year. Today, we’ve got over 70 scrappy builders working together to create the world’s best product data platform—but there’s always room for more!
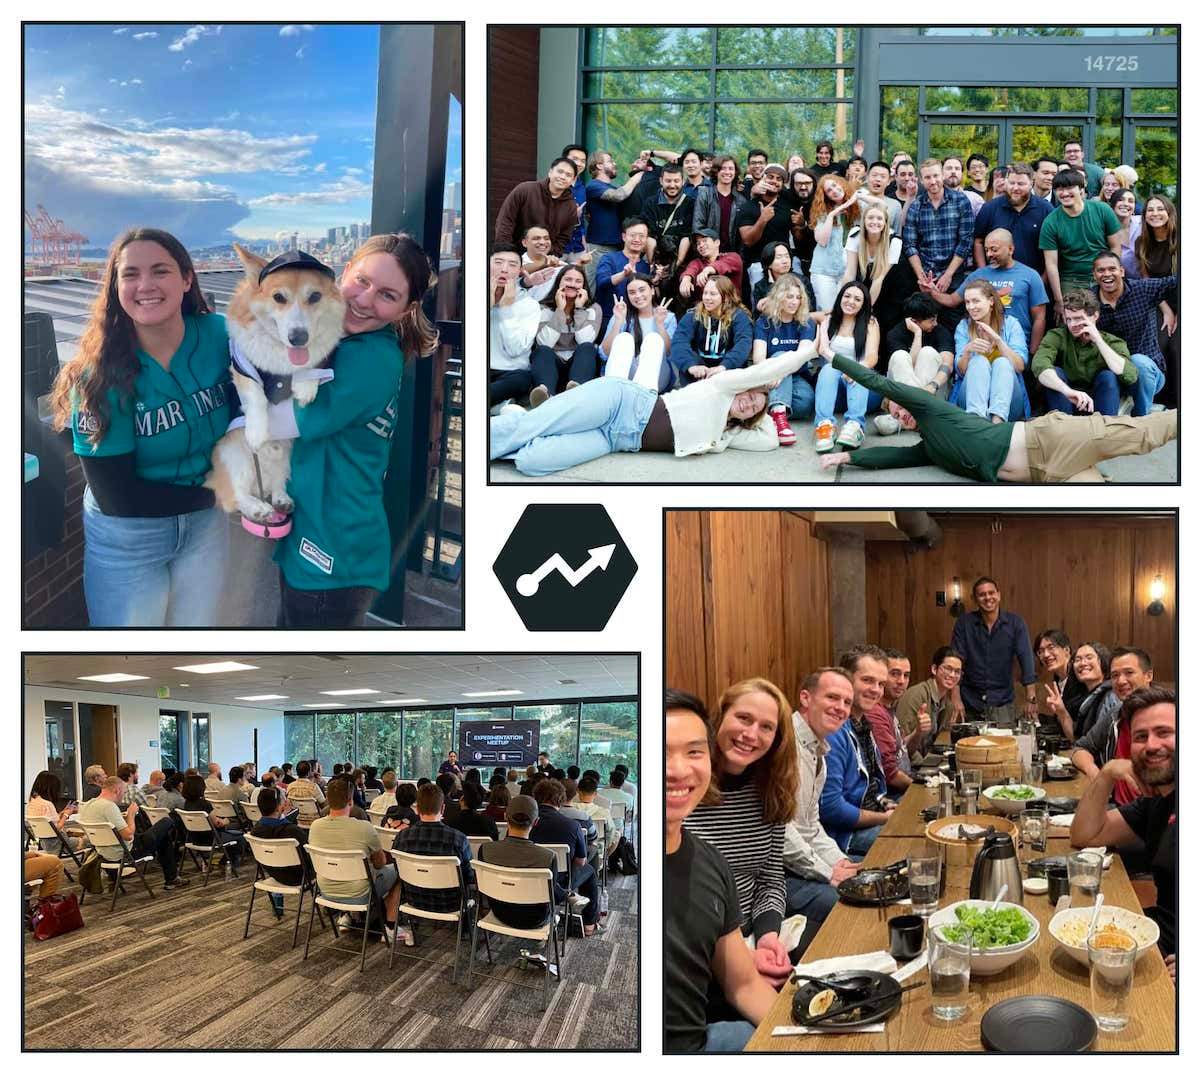
From all of us on the Statsig team, thanks for your interest, support, questions, requests, ideas, and collaboration. We couldn’t have done it without you.
Here’s to 2024, and happy experimenting! 🥂
Note: For a complete list of feature announcements, see our Product Updates page.
Get started now!
